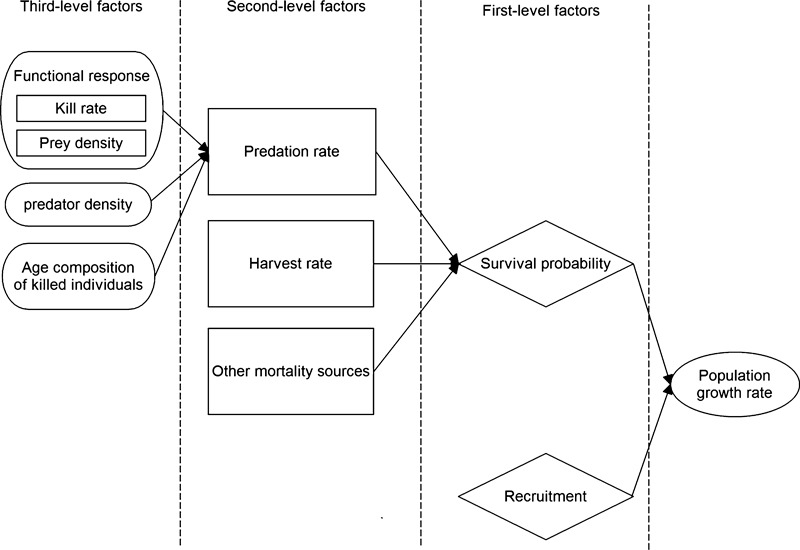
Fig. 1.

Structural diagram illustrating the demographic processes leading to the observed growth rate in prey populations, decomposed into three levels of increasing detail. Level 1 includes the effect of main demographic rates (age-specific survival, recruitment); in level 2, individual survival is decomposed into its basic mechanisms, that is, the main age-specific mortality factors (predation rate, harvest rate, natural mortality rate); in level 3, age-specific predation rate is decomposed into its basic mechanisms, that is, kill rate, predator density, prey density and age class of killed individuals.
