
Figure 4.
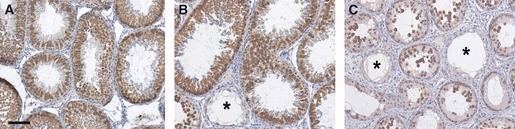
VASA immunostaining of germ cells (GC) in control and sludge-exposed rams. VASA staining shows the phenotype of control animals (A) and two distinct groups of sludge-exposed animals: S1, which had normal GC counts compared with controls (B) and S2, which had statistically significant lower GC counts than controls (C). Note that although S1 animals had normal GC numbers, some also had occasional Sertoli cell-only (SCO) tubules (*), whereas S2 animals all exhibited varying degrees of GC loss and more frequent SCO tubules were evident. Scale bar = 100 μm.