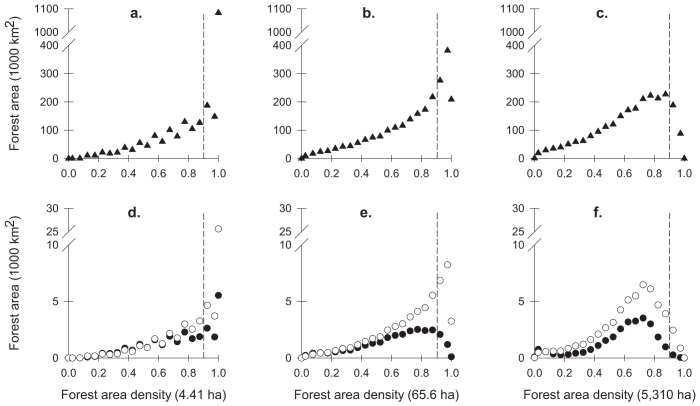
Figure 1. The area distributions of initial forest, forest gains, and forest losses in relation to forest area density in 2001 or 2006 for three representative neighborhood sizes.
Top row: initial forest area in relation to initial forest area density in 2001 (triangles) for neighborhood sizes of (a) 4.41 ha, (b) 65.6 ha, and (c) 5,310 ha. Bottom row: gross forest area lost in relation to initial forest area density in 2001 (open circles) and gross forest area gained in relation to final forest area density in 2006 (closed circles), for neighborhood sizes of (d) 4.41 ha, (e) 65.6 ha, and (f) 5,310 ha. The net change for each value of forest area density is the difference between gross loss and gross gain. Forest interior area for each data series includes the three symbols to the right of the dotted vertical reference lines.

