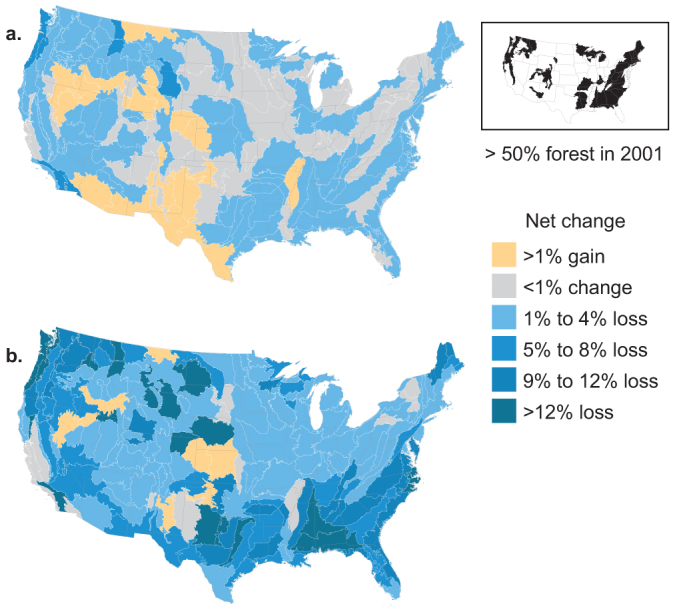
Figure 2. Net change in forest area from 2001 to 2006.

(a) All forest. (b) Forest interior in a 65.6-ha neighborhood. Ecological sections44 are shaded and State boundaries are shown for comparison. In the inset map, forest-dominated ecological sections are those that contained more than 50% forest in 2001.
