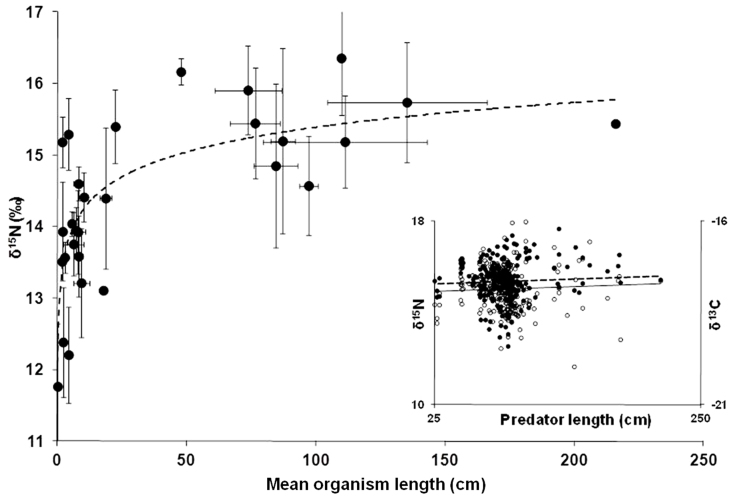
Figure 3. Relationship between mean organism size and mean δ15N values for species sampled in this study.
Line represents logarithmic fit to data (δ15N = 0.4997*ln(size); r2 = 0.56). Inset shows relationship between length of individual meso- and higher level predators (>25 cm) and δ13C ( ) and δ15N (
 ) values. Relationship between size and δ13C (δ13C = 0.0018(size) + 15.2; r2 = 0.0038) and δ15N (δ15N = 0.0011(size) − 17.9; r2 = 0.0026) are not significantly different from zero (P = 0.41 and 0.31, respectively).

