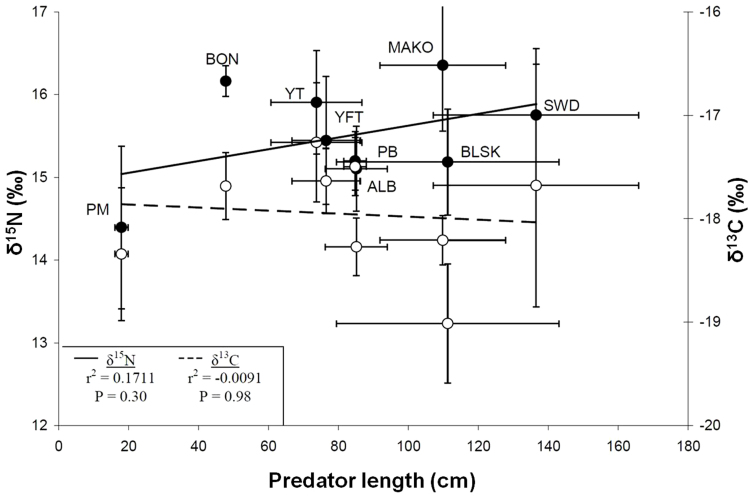
Figure 4. Relationship of predator size and isotope values.
For nine predator species δ13C ( ) and δ15N values (
 ) are shown against predator size (CFL in cm). All values are mean ± SD. Lines represent linear fits for size versus δ13C (- -) and size versus δ15N (—). Correlations were not significant at the α = 0.05 level (inset).

