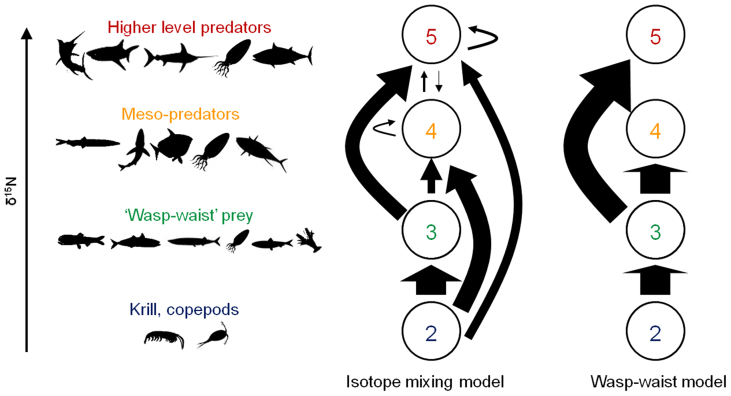
Figure 6. Schematic showing isotope mixing model estimates of food flow through the southern CCLME pelagic ecosystem, indicating high omnivory and high use of TG2 and TG3 by meso- and higher level predators, respectively.
Arrows indicate inputs of a trophic group to another; arrow size is proportional to median mixing model estimates of prey inputs of trophic group to others. 95% confidence intervals for input estimates shown in Table 2. Far right schematic shows proportional prey inputs expected under wasp-waist ecosystem dynamics.

