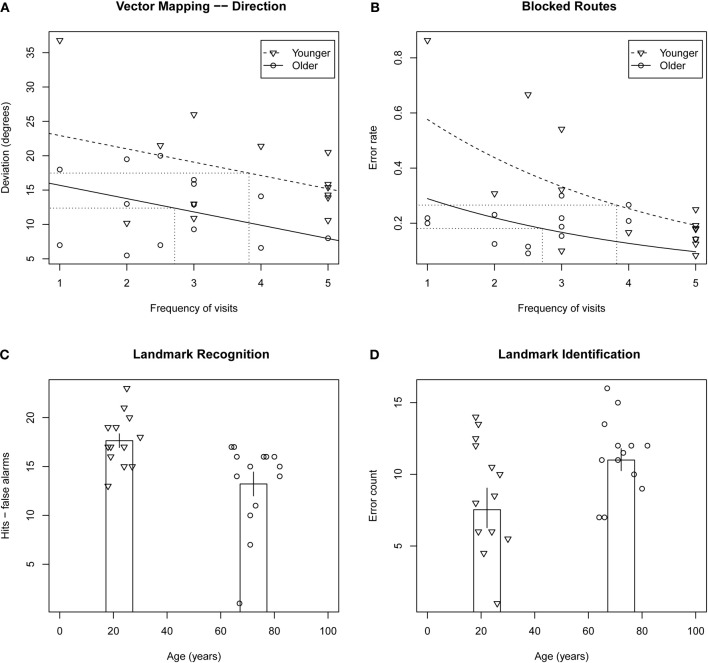
Figure 1.
Top row: scatterplots of mental navigation performance versus frequency of visits to Toronto for vector mapping—direction deviation (A) and blocked routes error rate (B), tasks on which older adults performed significantly better than younger adults. Fitted models for younger and older adults are indicated by dashed and solid lines, respectively, and averages for the two groups are indicated by dotted lines. Bottom row: scatterplots of performance on landmark recognition (C) and landmark identification (D) versus age. Column height indicates average performance for each of the two groups. Error bars indicate ± one standard error.

