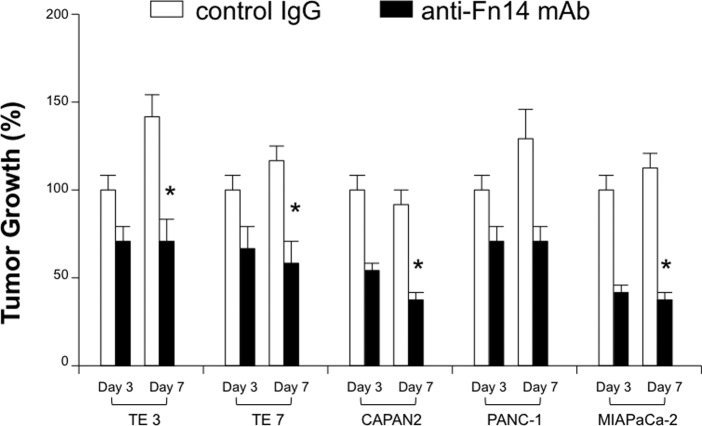
Figure 4.
Growth inhibition of esophageal and pancreatic cell lines by anti-Fn14 mAb (25 mg/ml). The cancer cells were co-cultured with either control IgG (open boxes) or anti-Fn14 mAb (closed boxes). *Indicates statistical difference in the growth of tumor cells treated with anti-Fn14 mAb compared to the controls. The results are expressed as the mean number of three wells ± SD obtained from one representative of three individual experiments.

