
Figure 3.
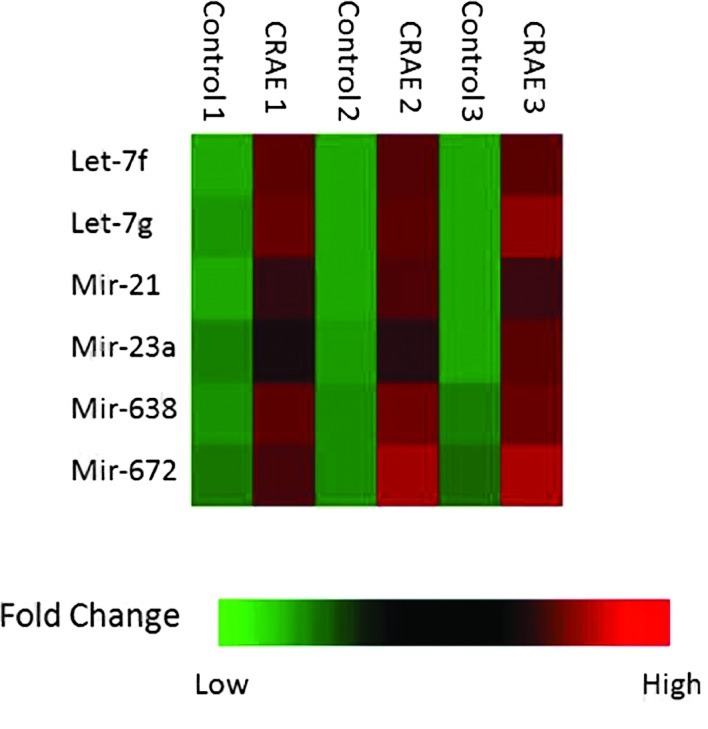
Quantitation of the six miRNAs which exhibited a significant change in expression after treatment with 175 μg/ml of CRAE. The microarray experiment used three pairs of chips: CRAE 1 (treatment with CRAE) and Control 1 (untreated), CRAE 2 and Control 2, and CRAE 3 and Control 3.