
Figure 4.
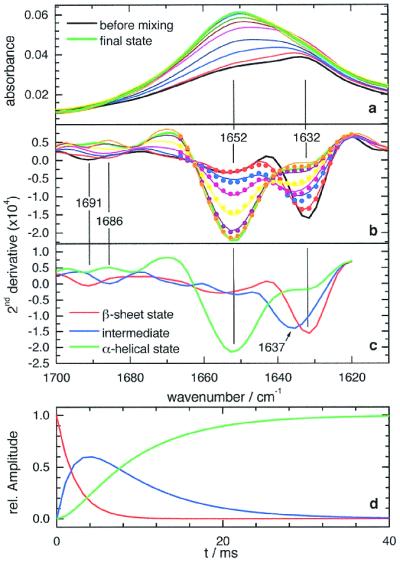
Time-resolved FTIR spectra and kinetic analysis. (a) Time-resolved absorbance spectra taken along the observation channel. Time-resolved spectra at 1.1, 3.4, 5.7, 10.2, 21.6, and 103 ms. Spectrum before mixing (black line) and final state spectrum (green line). (b) Second derivative spectra of a (solid lines) and results of a three-state exponential fit (dots, plotted only up to 1,670 cm−1). Line coloring is the same as in a. (c) The three basic spectra, resulting from the fit. (d) Time course of the three states as deduced by the fit.