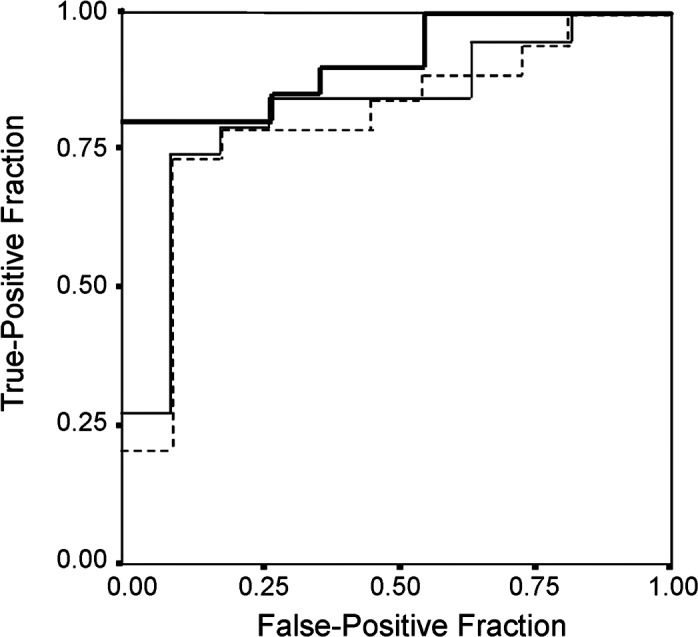
Figure 4.

Graphs show receiver operating characteristic curve for differentiating Child-Pugh class B/C from Child-Pugh class A. Note fraction of true-positive results (sensitivity) and false-positive results (1 minus specificity) for reduction-%LMR (thick solid line), LHL15 (thin solid line) and HH15 (dotted line). Value of 0.5 is no better than expected by chance and value of 1.0 reflects perfect indicator. Calculated area under curve is 0.91 for reduction-%LMR, 0.82 for LHL15 and 0.81 for HH15.
