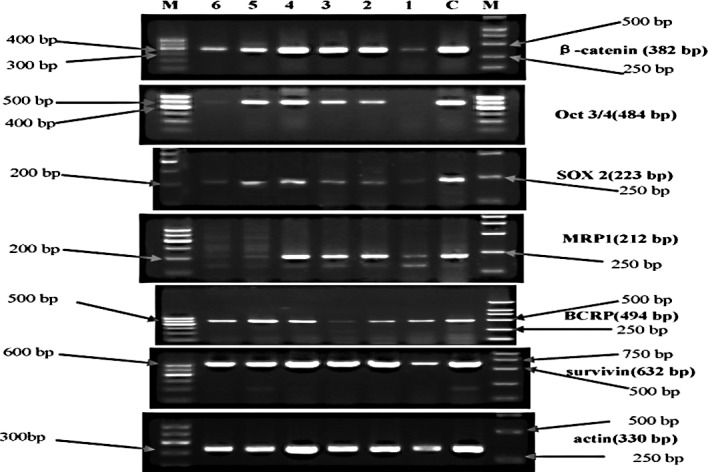
Figure 2.

Electrophorogram of mRNA expression of the relative markers in each cell generation in the experimental group. M, molecular weight marker; the left marker is the 100-bp ladder, the right marker is DL2000 (apart from Oct 3/4, whose marker was the 100-bp ladder). C, control group. Lanes 1, 2, 3, 4, 5 and 6 represent the first, second, third, fourth, fifth and sixth cell generation, respectively.
