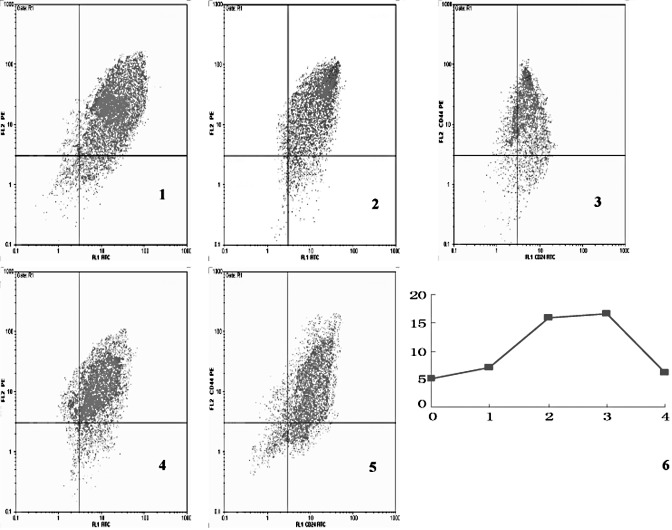
Figure 4.
Proportion of CD44+/CD24− cells in the experimental group. Images 1, 2, 3, 4 and 5 are the proportion of CD44+/CD24− cells in the non-treated group, the first, second, third and fourth generation of cells, respectively. The CD44+/CD24− cells were located in the upper left quadrant. Image 6 is a line graph showing the fluctuation in the proportion of CD44+/ CD24− cells in different cell generations. The x-axis indicates the cell generation, whereas the y-axis denotes the percentage.

