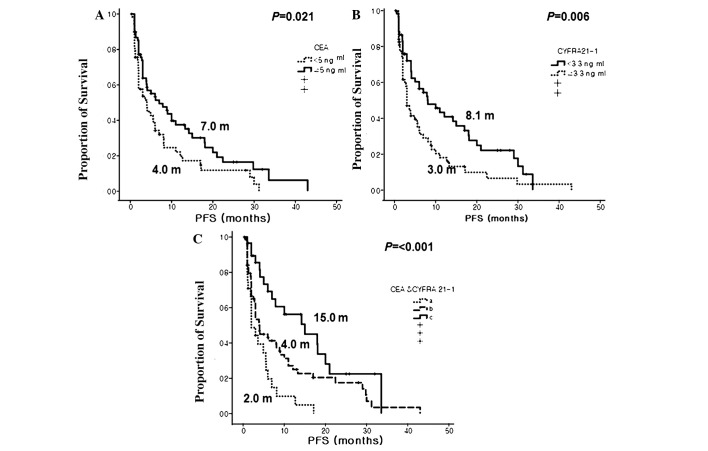
Figure 1.
Progression-free survival (PFS) curves according to pre-treatment serum levels of carcinoembryonic antigen (CEA) and cytokeratin-19 fragments (CYFRA 21-1). (A) CEA. (B) CYFRA 21-1. (C) Combinations of CEA and CYFRA 21-1 by group: (a) patients with l-CEA and h-CYFRA 21-1, (b) patients with l-CEA and l-CEA or h-CEA and h-CYFRA 21-1 and (c) patients with a h-CEA and l-CYFRA 21-1.

