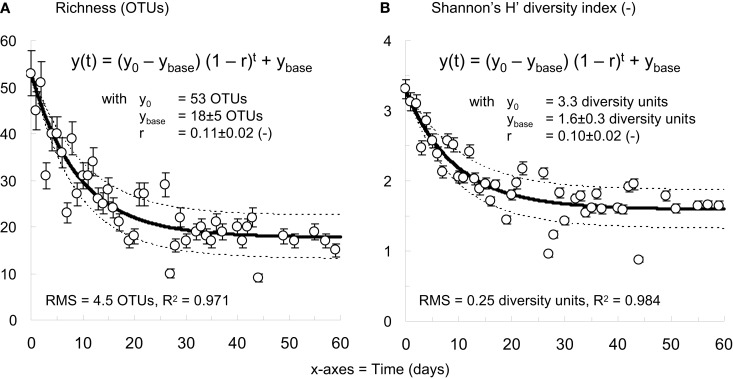
Figure 5.
The bacterial community present in R6 exhibited a strong decrease of about 66% in richness (A) and of about 52% in Shannon’s H’ diversity (B) from inoculation with flocculent activated sludge from a full-scale BNR-WWTP fed with real wastewater to formation of early-stage granules fed with an acetate-based synthetic influent. Mathematical negative exponential growth models successfully explained the evolution of both indices during reactor start-up (R2 = 0.97–0.98). The model trends are given with standard deviation intervals computed from 1000 Monte Carlo simulations. Legend: y0: initial richness or diversity value, ybase: average final richness or diversity value after 60 days, r: negative growth rate, RMS: root mean square error.

