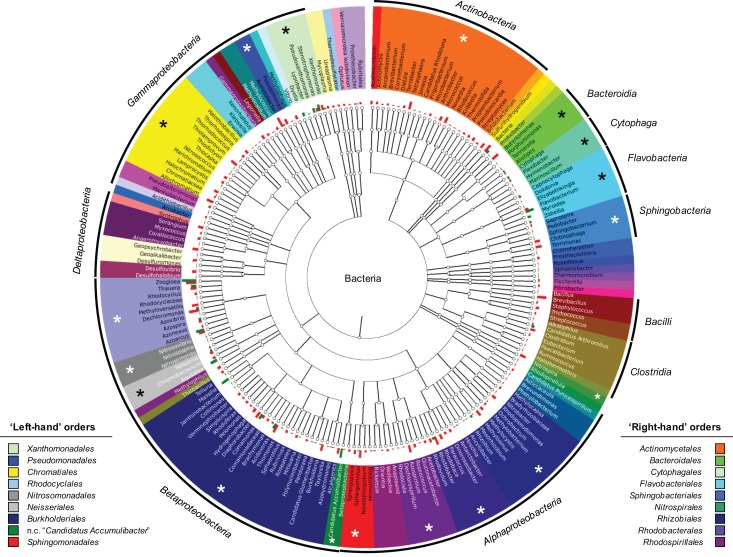
Figure A1.
Bacteriome phylogenetic tree constructed in MG-RAST (Meyer et al., 2008) with the pyrosequencing datasets of the two biomass samples collected on day 2 (flocculent sludge, red bar plot) and day 59 (early-stage AGS, green bar plot) in the R6 reactor. Each bar plot is related to the number of pyrosequencing reads detected per bacterial affiliation. The tree is presented with classes (outer black circle segments) and orders subdivisions (colored slices), and bacterial genera names. The identity of target orders marked with an asterisk is given for each left-hand and right-hand half of the circular tree. The RDP database (Cole et al., 2009) was used as annotation source, and a minimum identity cutoff of 97% was applied.

