Figure 1.
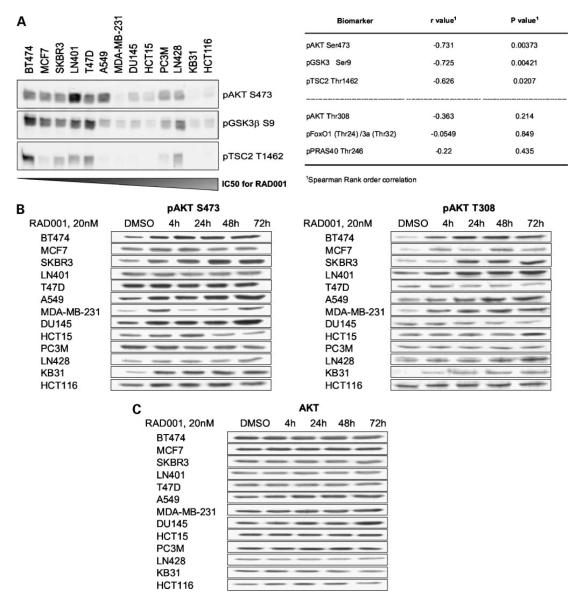
Antiproliferative response to RAD001 correlates with basal activation of the AKT pathway but not with AKT phosphorylation response following RAD001 treatment. A, left, basal expression levels of phospho-AKT S473, phospho-GSK3β S9, and phospho-TSC2 T1462 in a mixed panel of human cancer cell lines was measured by immunoblot analysis. Cell lines are listed according to their sensitivity to RAD001 treatment (antiproliferative IC50: listed in Table 1). Right, Spearman rank order correlation analysis of AKT and AKT substrate phosphorylation status was done based on the IC50 values for RAD001. R values ± 0.5 and P < 0.05 are considered statistically relevant. B, cells were treated for the indicated times with vehicle control (DMSO) or 20 nmol/L RAD001. Cell lines are listed according to ascending IC50 values for RAD001 (antiproliferative IC50: listed in Table 1). Total protein lysates were subjected to immunoblot analysis. RAD001-induced effects are shown for AKT S473 and AKT T308 phosphorylation. C, AKT levels are used as a loading control.

