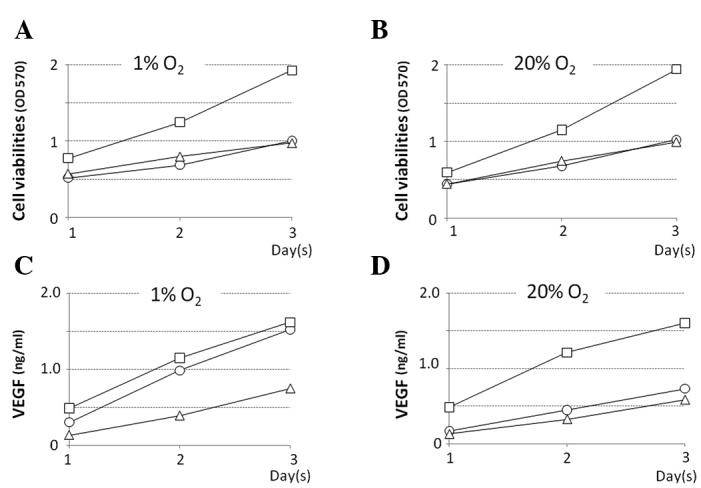
Figure 1.

Cell viability under a (A) 1% O2 and (B) 20% O2 environment. X-axis, time (in days). Y-axis, cell viability (absorbance). In all of the cell lines, the cell proliferation potency in an anoxia environment was the same as that in a normal oxygen environment. Level of VEGF (ng/ml) in the different culture mediums under a (C) 1% O2 and (D) 20% O2 environment. X-axis, time (in days). Y-axis, levels of VEGF (ng/mg). BxPc-3 (open squares), QGP-1 (open circles) and AsPC-1 (open triangles) cells. The VEGF secretional capacity of QGP-1 was increased in the anoxia environment.
