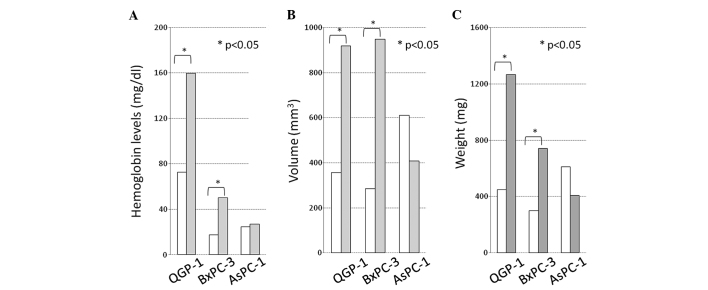
Figure 7.
(A) Hemoglobin levels, (B) volume (mm3) and (C) weight (mg) of the tumors. Tumors of bevacizumab-administered mice (white bar) and tumors of IgG-administered mice (grey bar). The hemoglobin levels, the volume and the weight of the tumors achieved significant differences between the bevacizumab- and IgG-administered mice bearing QGP-1 and BxPC-3 cells. *p<0.05.

