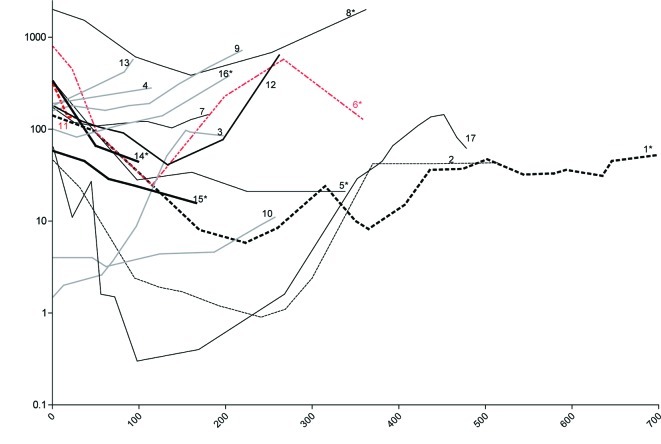
Figure 1.
Changes in prostate-specific antigen (PSA) after start of treatment. PSA levels of all 17 patients are shown. Numbers indicate patient no. as denoted in Table I. Patient no. 3, 4, 9, 10, 13 and 16 did not respond to therapy with no reduction in PSA levels (grey lines). Patient no. 4 received treatment for only 4 days. *Patients treated with additional strontium (Sr)-89.

