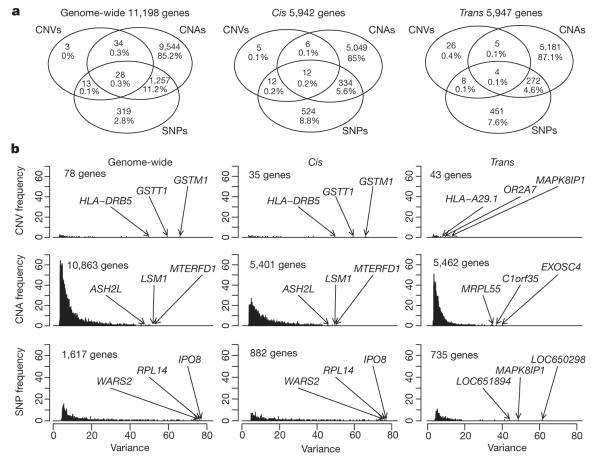
Figure 1. Germline and somatic variants influence tumour expression architecture.
a, Venn diagrams depict the relative contribution of SNPs, CNVs and CNAs to genome-wide, cis and trans tumour expression variation for significant expression associations (Šidák adjusted P-value ≤0.0001).
b, Histograms illustrate the proportion of variance explained by the most significantly associated predictor for each predictor type, where several of the top associations are indicated.

