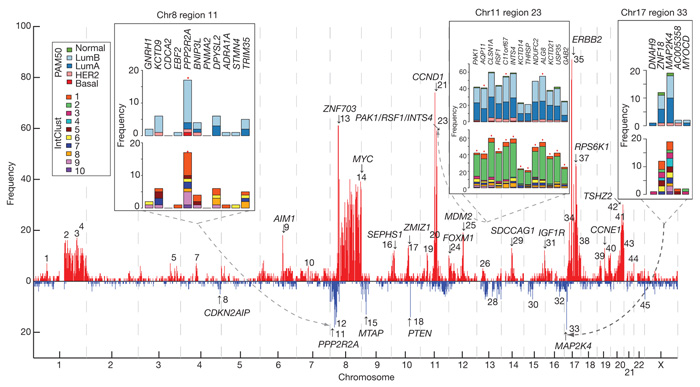
Figure 2. Patterns of cis outlying expression refine putative breast cancer drivers.
A genome-wide view of outlying expression coincident with extreme copy number events in the CNA landscape highlights putative driver genes, as indicated by the arrows and numbered regions. The frequency (absolute count) of cases exhibiting an outlying expression profile at regions across the genome is shown, as is the distribution across subgroups for several regions in the insets. High-level amplifications are indicated in red and homozygous deletions in blue. Red asterisks above the bar plots indicate significantly different observed distributions than expected based on the overall population frequency (χ2 test, P < 0.0001).

