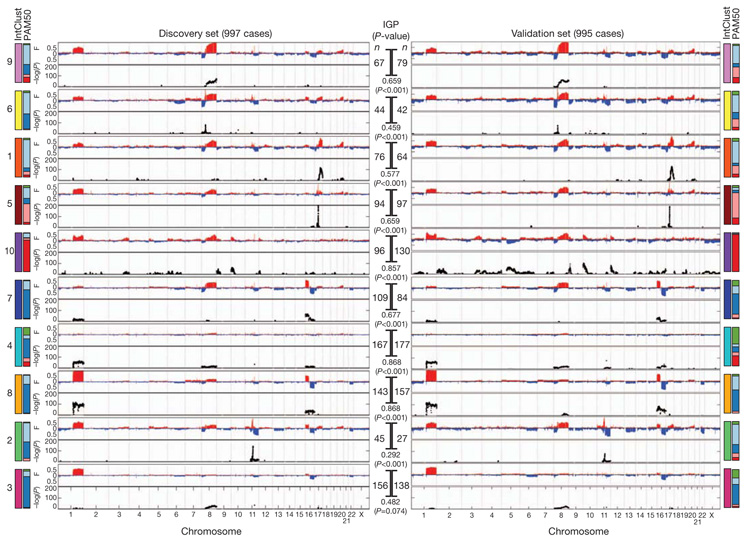
Figure 4. The integrative subgroups have distinct copy number profiles.
Genome-wide frequencies (F, proportion of cases) of somatic CNAs (y-axis, upper plot) and the subtype-specific association (−log10 P-value) of aberrations (y-axis, bottom plot) based on a χ2 test of independence are shown for each of the 10 integrative clusters. Regions of copy number gain are indicated in red and regions of loss in blue in the frequency plot (upper plot). Subgroups were ordered by hierarchical clustering of their copy number profiles in the discovery cohort (n = 997). For the validation cohort (n = 995), samples were classified into each of the integrative clusters as described in the text. The number of cases in each subgroup (n) is indicated as is the in-group proportion (IGP) and associated P-value, as well as the distribution of PAM50 subtypes within each cluster.

