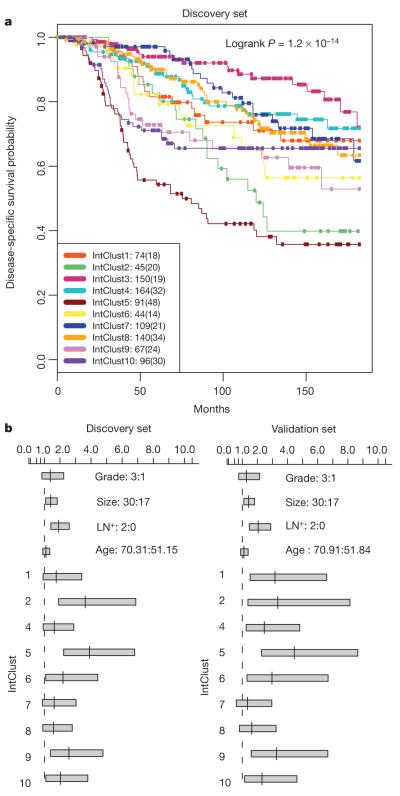
Figure 5. The integrative subgroups have distinct clinical outcomes.
a, Kaplan–Meier plot of disease-specific survival (truncated at 15 years) for the integrative subgroups in the discovery cohort. For each cluster, the number of samples at risk is indicated as well as the total number of deaths (in parentheses). b, 95% confidence intervals for the Cox proportional hazard ratios are illustrated for the discovery and validation cohort for selected values of key covariates, where each subgroup was compared against IntClust 3.

