
Figure 5.
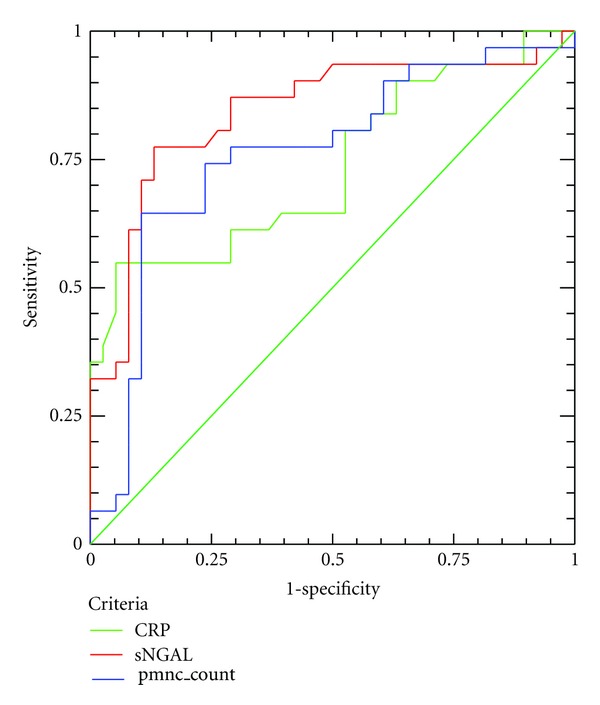
ROC curve analysis for CRP (green line), serum-NGAL (red line), and PMN count (blue line) for the discrimination of UA patients from patients with SA.
Official websites use .gov
A
.gov website belongs to an official
government organization in the United States.
Secure .gov websites use HTTPS
A lock (
) or https:// means you've safely
connected to the .gov website. Share sensitive
information only on official, secure websites.
ROC curve analysis for CRP (green line), serum-NGAL (red line), and PMN count (blue line) for the discrimination of UA patients from patients with SA.