Abstract
MicroRNA profiling of diseased/non-diseased tissue has identified expression signatures associated with a wide range of pathogenic conditions including malignancy. For example, colon cancer is associated with the under expression of miRNA-143 yet the molecular etiology of under expression is unknown. The K-Ras oncogene is a target of miRNA-143. Here, we show that the ecotropic viral integration site 1 oncoprotein (Evi1) is a transcriptional suppressor of the miRNA-143 gene. We find an indirect relationship between miRNA-143 and Evi1 expression. A complex molecular axis linking Evi1, miRNA-143 is operational in human colon cancer.
Keywords: microRNA, Evi1, colon cancer, RNA interference
1. Introduction
MicroRNA are a relatively recently described class of noncoding RNA that impact gene expression by translational arrest or direct degradation of mRNA depending upon the degree of homology between the miRNA itself and the target RNA. Presently, the human genome harbors at least 940 genes encoding miRNA (Sanger miRBase, Release 15,April 2010) but this number is expected to increase with the newly gained power of deep sequencing technology. Numerous studies have been conducted to profile miRNA in healthy and diseased tissue with the majority of investigations focusing on the process of malignancy. Indeed, a global reduction in mature miRNA expression has been described in a broad range of primary cancerous tissues, the exact etiology of which is unclear (1). MiRNA expression patterns have been implicated in diverse processes in carcinogenesis from metastasis to oncogene expression. For example, recent work has identified both the p53 tumor suppressor and K-Ras as targets of miRNA (2-4). Both proteins are known targets for at least two miRNA species (p53: miRNA-125a/b and K-Ras: miRNA-let7a/143). While much data has emerged on presumed miRNA targets, less is known regarding the cellular cues that activate or repress a given miRNA gene. Given that miRNA are potential druggable host factors, cellular proteins that impact their gene expression may serve as additional targets for inhibition or stimulation. Furthermore, the discovery of cellular cofactors impacting miRNA gene expression may offer broader pathogenic insight into basic disease processes. Here, we focus on human miRNA-143 that is under-expressed in several human neoplasms including colon, ovarian, esophageal, bladder and B-cell cancer (5,6). Using cell lines and primary cancerous/noncancerous tissue, we show that miRNA-143 expression is directly controlled by the ecotropic viral integration site 1 oncogene (Evi1) that serves as a transcriptional suppressor of the miRNA-143 gene. In cell lines and primary tumor tissue, we describe an axis that inversely links Evi1 protein levels to miRNA-143 expression and the latter’s oncogenic target: K-Ras.
2. Materials and Methods
Constructs
MiRNA expression vectors were created by amplifying ~300 nt of pri-miRNA from human genomic DNA. Inclusion of appropriate restriction enzyme sites in primers allowed their introduction into pcDNA 3.1 (+) vector (Invitrogen). MiRNA-143 mutants were created using the QuickChange™ site-directed mutagenesis kit (Stratagene). The mutagenesis reaction was performed in 50 μL total volume using 80 ng of template DNA according to the instructions of the manufacturer. All constructs were sequence verified. Luciferase based reporter assays were created by inserting PCR amplified or oligonucleotide annealed target sequences into a dual-glo vector encoding Firefly and Renilla luciferase (Promega). All nucleic acid sequences are shown in Supplementary Data Table 1.
Cell culture and related assays
HEK 293 and Huh-7 cells were obtained from ATCC and cultured in RPMI or Dulbecco’s modified Eagle’s (DMEM) media, respectively, supplemented with 10% fetal bovine serum and antibiotics. An Evi1 expression vector was a kind gift of Dr. Hisamaru Hirai (University of Tokyo, Tokyo, Japan). Antibodies used included those to K-Ras, Evi1, GAPDH (Cell Signaling). Evi1 and control siRNA were provided by SantaCruz Biotechnology. All transfections were performed using Lipofectamine 2000, according to the instructions of the manufacturer (Invitrogen). Cellular activity of luciferase based reagents were quantified 48 hours after cellular transfection using the Dual-Glo™ (Promega) luciferase assay kit, Chromatin immunoprecipitation assays were performed according to the manufacturer’s instructions using a ChIP assay kit (Upstate). Briefly, HEK 293 cells were transfected with an Evi1 expression vector. Forty-eight hours after transfection, cells were havested and DNA was crosslinked to histone by adding 1% formaldehyde. Cell lysates were prepared with SDS lysis buffer and subsequently sonicated to shear DNA. Following immunoprecipitation of the diluted lysate with the appropriate antibodies, the eluates were reverse crosslinked and subjected to PCR with specific primers for the miRNA-143 promoter region; 1% of lysate was used as the input control.
Human Tissue
Rhode Island Hospital Human Subjects Committee approval was gained to utilize primary tissue from a tumor bank of de-identified pathologist-reviewed samples obtained at surgical resection and immediately snap frozen.
Northern blot
Twenty five μg total RNA was loaded on 15% acrylamide gel and transferred onto Hybond N+ membrane. The miRNA-143 probe (5′-TGA GAT GAA GCA CTG TAG CTC ACC TGT CTC-3′) was labeled by using Biotin RNA labeling kit (Roche). Hybridization was carried out at 42°C for 12 hours and signal was detected by BrightStar BioDetect kit (Ambion).
RT–PCR quantification
Total RNA was extracted by TRIZOL and 1 μg RNA was used for cDNA synthesis using MMLV reverse transcriptase (New England Biolabs) with random primers. Primer sequences used are in the Supplementary Data Table . PCR analysis was performed by RT2 Real-TimeTM SYBR Green PCR master mix (SuperArray) according to the manufacturer’s protocol using the Eppendorf realplex2 Mastercycler machine (Eppendorf). Results were normalized with respect to beta-actin expression. TaqMan® microRNA assays (Applied Biosystems) that include RT primers and TaqMan probes were used to quantify the expression of mature let7a and miRNA-143 in both tissue samples and cell lines. The mean Ct was determined from triplicate PCR reactions. Gene expression was calculated relative to actin expression, also quantified by independent triplicate measurements.
Directional motility and MTT assays
Directional motility was measured using the ATP Luminescence-Based Motility-Invasion (ALMI) assay. Briefly, serum-free culture medium was placed in the bottoms of blind well chambers (Neuro Probe, Gaithersburg, MD, USA) which were separated by 8-μm pore diameter polycarbonate filters from the upper chambers. 100,000 viable Caco2 cells which had been transfected with either a miRNA-143 expression vector or empty vector were seeded into the upper chambers and cell migration was allowed to proceed for 30 min at 37°C in a CO2 incubator. Cells collected from either bottom, upper or undersurface of filters were quantified using ATPLite reagent (Perkin-Elmer, Waltham, MA, USA). The percentage of motile non-adherent cells in eight replicate assays was calculated and used for statistical analysis. The over all survival of miRNA-143 or empty vector transfected cells was quantified by MTT assay using Thiazolyl Blue Tetrazolium Bromide reagent with absorbance reading at 590nm after addition of MTT solvent (4 mM HCl, 0.1% Nondet P-40 (NP40) all in isopropanol).
Statistical Analysis
Data analyses were conducted using non-parametric statistics which do not require distributional assumptions of the data. Specifically, the Wilcoxon sign-rank test of the median was used to compare the median of each pairwise difference to zero (no difference). This test is a nonparametric alternative to the paired t-test. In addition, the Spearman’s rho (R, rank correlation coefficient) was used to measure the relationship between two variables. Spearman’s rho is analogous to the Pearson product moment correlation coefficient but is calculated on ranked data, thus is robust to extreme observations.
3. Results
The K-Ras 3′-UTR harbors at least five miRNA-143 targets sites
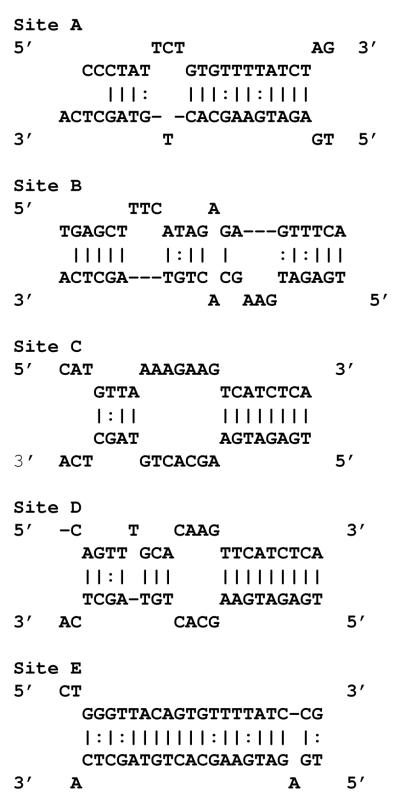
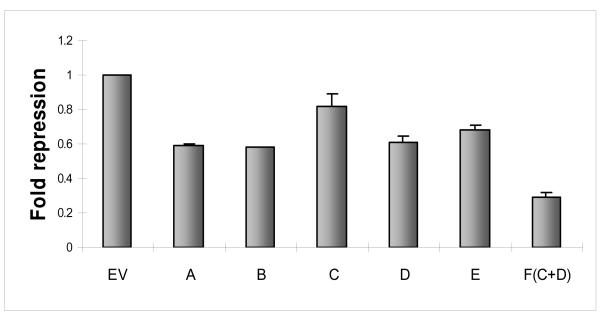
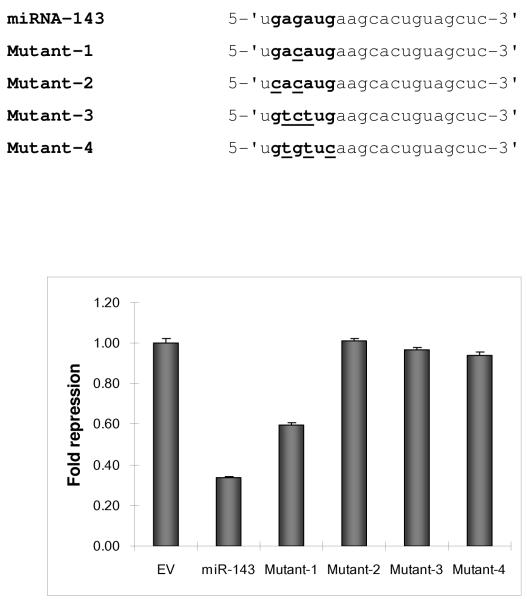
The complexity of miRNA/target mRNA interaction derives from emerging data that miRNA species may target not only the 3′-UTR but coding and promoter regions as well (7). Within the 3′-UTR, several areas may harbor potential target sites. Indeed, previous reports have identified and validated two miRNA-143 target sites in the 3′-UTR of K-Ras by using miRNA target algorithms such as TargetScan, miRanda and PicTar (8). Traditional luciferase based assays involving these sites revealed reduction (~30%) of reporter activity in the presence of miRNA-143. To determine whether additional sites existed, we analyzed the K-Ras 3′-UTR with rna22, a pattern based miRNA target detection algorithm (7). Rna22 identified three additional targets for miRNA-143 in the 3′-UTR of K-Ras (sites A-E, Figure 1a). We explored the validity of this bioinformatic forecast with the help of luciferase constructs that contained each of the 3′-UTR target sites in turn. Individual reporter constructs were introduced into HEK 293 cells along with a validated miRNA-143 expression or control plasmid. Luciferase levels were reduced by 20 to 70% (Figure 1b). We next probed the sequence specificity of this interaction by creating a series of miRNA-143 mutants harboring seed sequence mismatches at 5′ nucleotide positions 2-5 and 7. Compared to wild-type miRNA-143, all mutants harbored less activity against the K-Ras 3′-UTR with the most severe reduction in function of mutants with double or triple mismatches in the seed sequence (Figure 1c).
Figure 1.
miRNA-143 targets K-Ras.
a. The 3′UTR of K-Ras harbors five potential sites (A-E) of sequence homology to the seed sequence of miRNA-143. Blue letters denote the K-Ras mRNA target while red letters are used to denote miRNA-143 sequence. ( : ) indicates GU pair ( | ) indicates normal bond
b. K-Ras 3′ UTR segments A-E were incorporated into a dual luciferase reporter plasmid. All constructs were introduced into HEK 293 cells with miRNA-143 or an empty control vector (EV) and luminescence was measured at 48 hours. Compared to experiments involving EV, luciferase activity was repressed in all experiments involving the 3′-UTR segments, albeit at variable levels.
c. Point mutations were introduced into the seed sequence of miRNA-143 and four expression vectors were created (mutant 1-4). In the table, seed sequence is shown in bold lettering; sequence changes for each mutant are underlined. Wildtype (WT), mutant and control (EV) plasmids were transfected into HEK 293 cells along with the dual luciferase reporter plasmid and levels of luminescence were quantified at 48 hours.
Differential regulation of K-Ras in colon cancer by miRNA-let-7a and miRNA-143
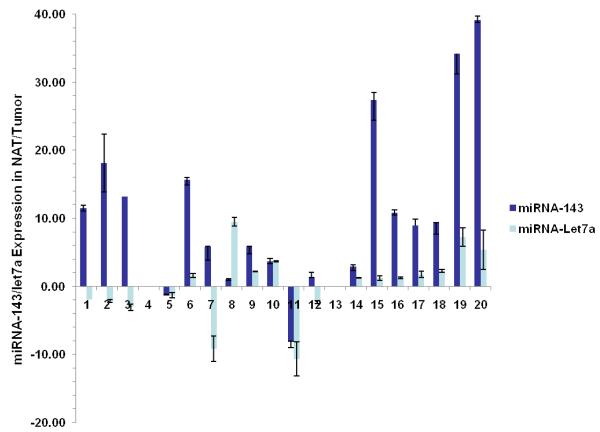
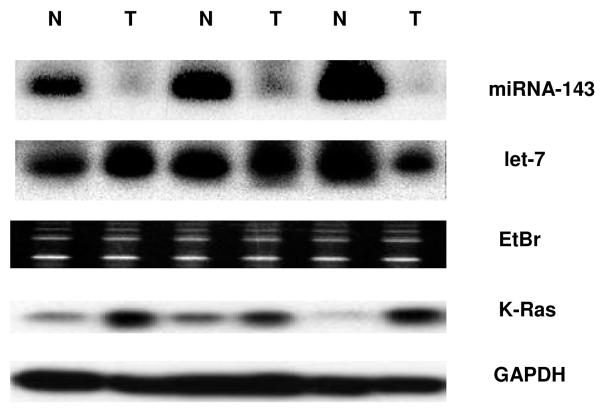
Regulation of K-Ras by members of the let-7 family has been conclusively demonstrated in primary patient samples of lung cancer with the caveat that not all types of cancer harbor the consistent inverse relationship between let-7a levels and K-Ras expression (3,9). For example, in cancers of colon and breast, the expression of let-7a is not as markedly decreased in cancerous vs. adjacent normal tissue as with miRNA-143 (3,10). To determine whether any correlation existed between the expression of K-Ras, let-7a and miRNA-143 in colon cancer, we first quantified mature miRNA levels by real time PCR and northern blot in twenty human samples of cancerous and adjacent normal colonic tissue. Indeed, levels of miRNA-143 were reduced an average of 4-fold in neoplastic tissue compared to surrounding normal tissue (p=0.001); however, the levels of let-7a showed no statistically significant difference (p=0.263) (Figure 2a,b). As expected, expression of K-Ras protein was inversely related to miRNA-143 expression in the colon cancer samples studied by Western blot (Figure 2b).
Figure 2.
Differential expression of miRNA-143, let-7a and K-Ras in colon cancer
a. Real-time RT-PCR was used to quantify levels of mature miR-143 and let-7a in twenty samples of human colon cancer in both frank cancerous tissue and surrounding normal adjacent tissue (NAT). Patterns of expression are presented as fold comparisons between cancerous and NAT for each miRNA (miRNA-143: dark blue bars and let-7a: light blue bars). Data from 18 samples are presented; two outliers (cases # 4 and #13) with a >50 fold difference in miRNA-143 expression are omitted for graphical clarity. We observed a statistically significant under-expression of miRNA-143 in cancerous tissue vs. NAT (p=0.001). No such relationship was found for let-7 (p=0.263).
b. In agreement with Real Time RT-PCR data for mature miRNA expression level, northern blots indicated a decreased level of miRNA-143 in cancerous tissue compared to NAT. No such difference was observed for let-7a in the samples studied. A strong inverse relationship was observed between levels of miRNA-143 and K-Ras, the latter quantified by western blot. GAPDH protein levels served as a loading control for western blot.
EVi1 is a transcriptional suppressor of the miRNA-143 gene locus
Why are levels of mature miRNA-143 reduced in colonic neoplastic tissue compared to paired normal tissue? Antecedent steps in the biogenesis of mature miRNA involve their transcription as long primary (pri-) molecules and subsequent cleavage into shorter precursor (pre-) molecules by the protein Drosha in the nucleus. We quantified levels of pre-miRNA-143 by Real Time PCR and found that levels were reduced by ~50% in neoplastic tissue compared to normal tissue (p=0.02). There was a statistically significant correlation between pri-miRNA-143 and pre-miRNA-143 values (R=0.72; p=0.001) as there was between precursor forms and mature miRNA (R=0.51; p=0.02). These findings are in agreement with earlier reports of miRNA-143 kinetics, albeit in murine systems, that demonstrated matched expression of precursor and mature miRNA-143 transcripts (11). Thus, altered transcription of the miRNA-143 gene emerged as one potential explanation for reduced mature miRNA-143 accumulation in cancerous tissue.
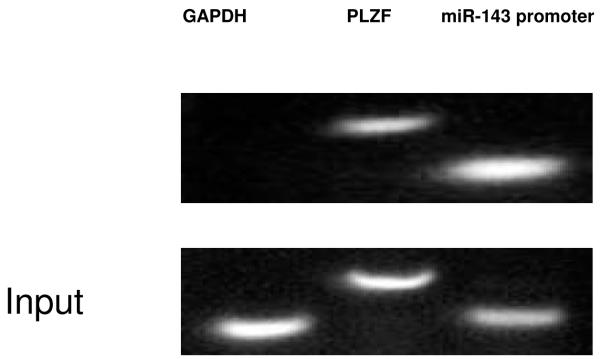
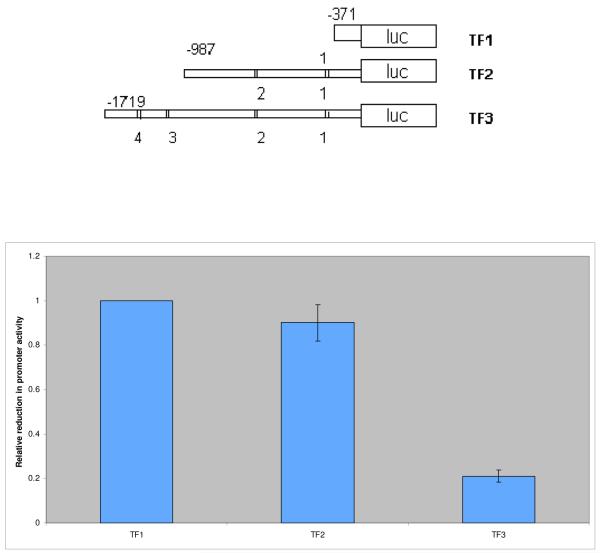
To identify potential regulators of miRNA-143 transcription we utilized a bioinformatic promoter mapping program. Our overall approach was guided by recent work demonstrating that ~60% of miRNAs have transcription factor (TF) binding sites within 1kb of the start of the pre-miRNA sequence (12). Our analysis identified four putative binding sites for the ecotropic viral integration site 1 (Evi1) protein in a 2kB region upstream of the miRNA-143 precursor with three of the sites located within 1 kb of the precursor (Figure 3a). The Evi1 gene encodes a zinc finger protein that impacts normal development as well as cellular proliferation, development and apoptosis (13,14). To experimentally verify Evi1/miRNA-143 gene locus interaction we performed chromatin immunoprecipitation (ChIP) assays. HEK 293 cells were transfected with an Evi1 expression vector (pEvi1) and chromatin fragments were immunoprecipitated with an antibody to Evi1. Specific primers were then used to amplify DNA fragments from the immunoprecipitates. The promoter region of the human promyelocytic leukemia zinc finger (PLZF) was used as a positive control given previous demonstration of its direct binding to and transcriptional control of the EVi1 gene (15). A control DNA fragment harboring no predicted binding sites served as a negative control. As seen in Figure 3b, the miRNA-143 and PLZF promoter regions but not the control fragment could be immunoprecipitated by antibodies to Evi1 thereby assigning binding specificity to Evi1. Next, we generated a series of luciferase based reporter vectors, each harboring a more truncated region of the miRNA-143 promoter region. These vectors were transfected into HEK 293 cells with an Evi1 expression plasmid (pEvi1). Normalized values reflected a decrease in reporter activity with increasing promoter length; constructs containing all four Evi1 binding sites were the most inhibitory to luciferase expression (Figure 3c). Finally, dose dependency of the Evi1 effect was demonstrated by transfecting increasing amounts of pEvi1 with the promoter construct harboring all four binding sites. As seen in Supp Fig. 1, increasing the amount of transfected pEvi1 was associated with corresponding decreased promoter activity.
Figure 3.
EVi1 is a transcriptional suppressor of miRNA-143
a. Schematic diagram of miRNA-143 genomic locus on chromosome 5. Four putative Evi1 binding sites exist in a 2kb region upstream of the start of pre-miRNA-143, denoted by black boxes. Consensus binding sequence is annotated below each box. Arrows ‘a’ and ‘b’ correspond to primer locations for amplification of recovered DNA for use in the ChIP assay.
b. Chromatin was immunoprecipitated with anti-Evi1 antibody and oligonucleotides ‘a’ and ‘b’ were used to PCR amplify the recovered DNA. Control amplifications were carried out using primers specific for the promoter region of the PLZF gene, a known transcriptional target of EVi1. A gene with no known regulation by EVI1 (GAPDH) served as a negative control.
c. We generated a series of miRNA-143 promoter region luciferase reporter constructs containing 0 (TF1), 2 (TF2) or all 4 (TF3) putative Evi1 binding sites. Lower panel: The constructs were transfected into HEK 293 cells and luminescence was measured at 48 hours. Data are shown as average reduction (+/-S.D.) in promoter activity relative to the basal endogenous pri-miRNA-143 promoter activity (TF1). Promoter activity was reduced by ~80% in experiments involving TF3.
The Evi1, miRNA-143 and K-Ras axis in human cancer
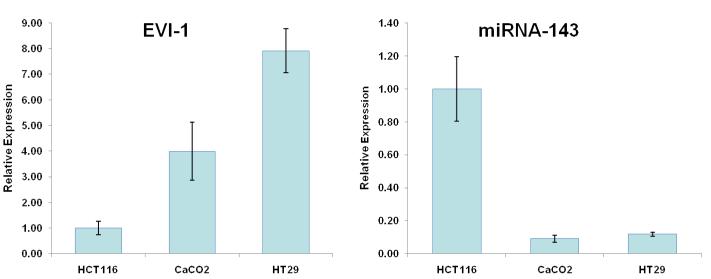
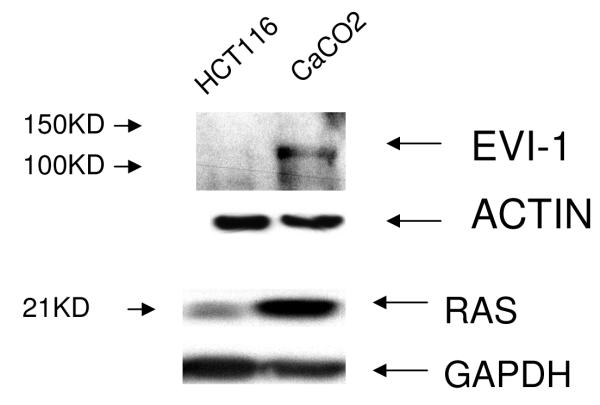
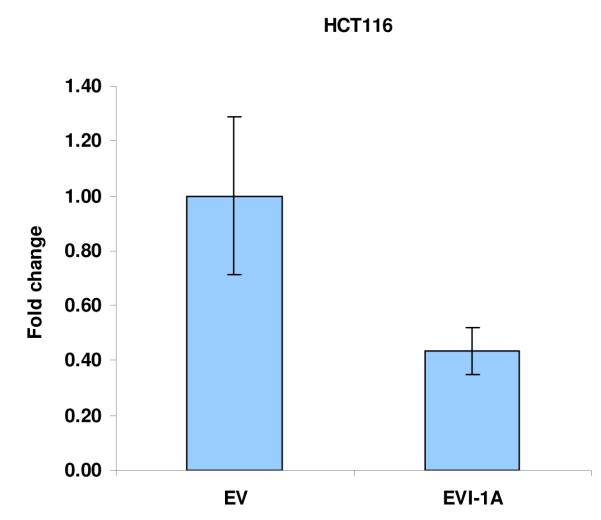
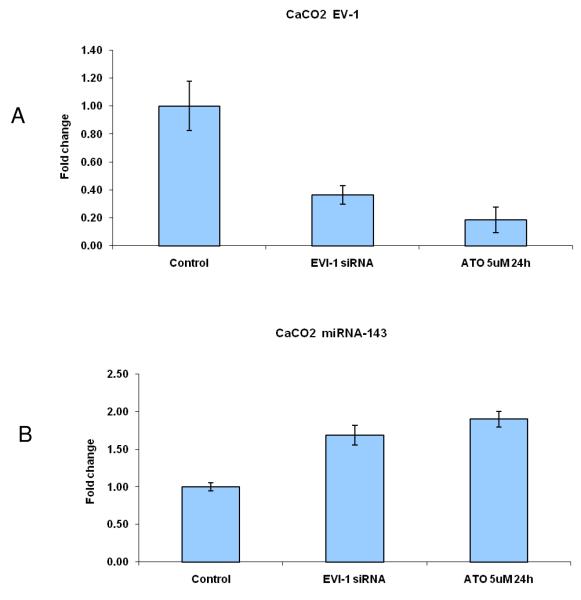
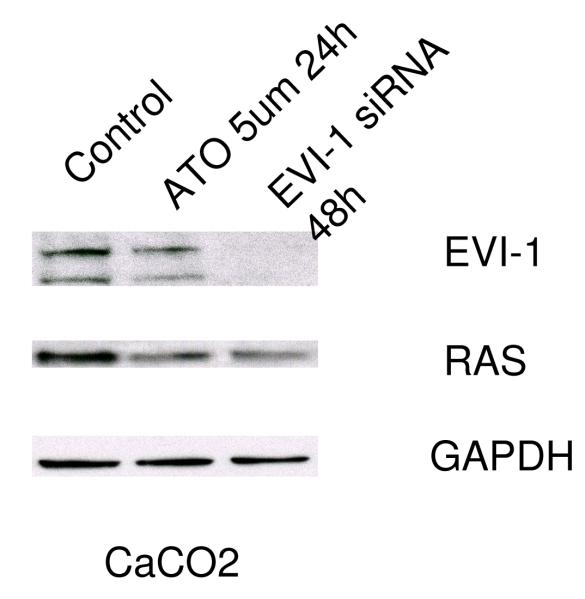
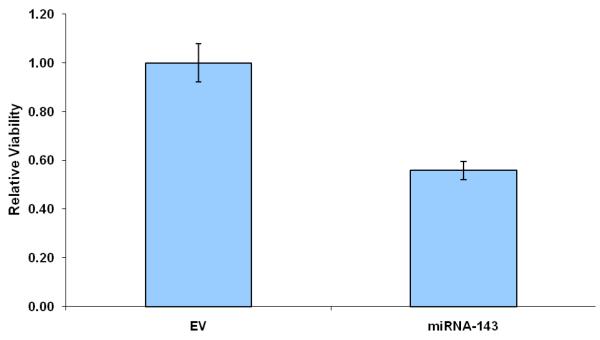
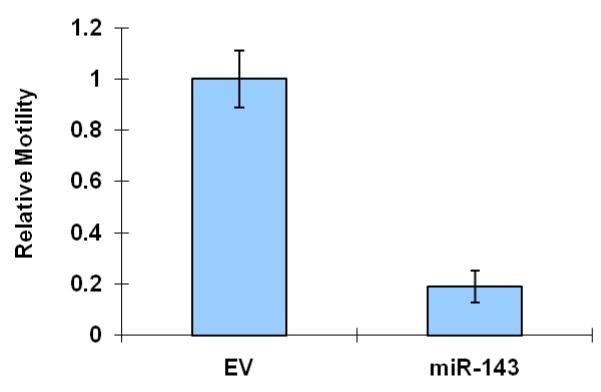
Further support for the role of Evi1 in controlling miRNA-143 transcription derived from experiments involving cell lines with different levels of miRNA-143/Evi1 expression. First, we observed an inverse relationship between levels of EVi1 and pri-miRNA-143 in HCT116, HT29 and Caco2 cells (e.g. Caco2/HT29 miRNA-143 low/Evi1 high vs. HCT116 miRNA-143 high/Evi1 low) (Figure 4a). As expected, levels of K-Ras were correlated to levels of Evi1 and miRNA-143 (Figure 4b). To stringently test the causal nature of this relationship, we manipulated Evi1 levels in HCT116 and Caco2 cell lines. Ectopic expression of EVi1 in HCT116 cells led to ~50% reduction (p<0.05) in pri-miRNA-143 levels (Figure 4c). In contrast, treatment of Caco2 cells with arsenic trioxide, a known and potent inhibitor of Evi1 as well as siRNA targeting EVi1, led to a ~2-fold statistically significant increase in miRNA-143 levels and a concomitant decrease in K-RAS (Fig 4d,e). The siRNAs were validated prior to use and reduced Evi1 mRNA levels by ~60% (data not shown). The relatively low levels of miRNA-143 in Caco2 cells allowed us to gauge the functional effect of ectopic miRNA-143 expression. We compared cellular motility and proliferation in cells that had been transfected with either an empty vector or a miRNA-143 expression cassette. As seen in Figs 4 e and f, ectopic miRNA-143 expression decreased proliferative capacity and motility, respectively.
Figure 4.
We profiled levels of pri-miRNA-143 and Evi1 in three colon cancer cell lines (CaCO2, HT29 and HCT116). (a) We observed an inverse relationship between levels of Evi1 and pri-miRNA-143, as measured by Real Time PCR. (b). Western blotting revealed a direct relationship between levels of Evi1 and K-Ras in HCT116 and CaCO2 cells. Beta actin and GAPDH were used to normalize RNA and protein input for RT-PCR and western blot, respectively. (c). Overexpression of Evi1 in HCT116 cells by transient transfection of an expression plasmid led to a ~50% reduction in pri-miRNA-143 levels. In contrast, depletion of Evi1 in CaCO2 cells by specific siRNA or arsenic trioxide (ATO) both for 24h led to a ~2-fold increase in pri-miRNA-143 levels (d). Western blot of cells treated with either anti-Evi1 siRNA (48h) or ATO (24h) revealed a decrease in levels of Evi1 and K-Ras proteins in CaCO2 cells (e). We measured the effect of miRNA-143 over expression in Caco2 cells by MTT assay (f) and motility assay (g). Over expression was associated with decreased proliferation and motility, respectively.
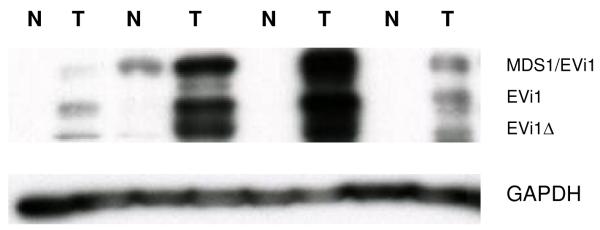
We next profiled Evi1 protein expression in cancerous and normal colonic tissue. As seen in Figure 5, cancerous tissue was associated with an increased expression of Evi1 protein in samples studied by western blot. When the analysis was extended to the RNA level in twenty further samples, we found that 75% of samples (15/20) had an average ~4-fold increase in Evi1 RNA levels in cancerous vs. normal colonic tissue. A similar level of increase has been recently reported in ovarian cancer which is also associated with decreased levels of miRNA-143 (16,17). Thus, as with our in vitro experiments, our data involving primary cancerous and normal tissue pointed to a pathway in which Evi1 suppresses miRNA-143 gene transcription which in turn leads to elevated levels of K-Ras in colon cancer.
Figure 5.
Multiple isoforms of EVi1 exist due to alternative splicing and usage of 5′-ends. Intergenic splicing leads to the formation of a fusion protein with MDS1. Western blotting of colonic tissue revealed over expression of Evi1,MDS1/Evi1 and a truncated version of Evi1 (ΔEvi1) in tumor tissue (T) compared to surrounding normal tissue (N). Similar expression patterns of MDS1/Evi1 and Evi1 have been recently described in ovarian cancer tissue and cell lines (17).
4. Discussion
Small RNA species such as miRNA are increasingly being recognized as influencing a myriad processes relevant to health and disease. In the setting of malignancy, numerous reports have used array technology to obtain quantitative information on miRNA expression patterns and a set of “oncomirs” have been identified. While much work has been done in establishing bonafide targets of disease related miRNA, relatively less is known about the transcriptional networks that mediate miRNA gene expression. Here, we provide evidence that the miRNA-143 locus in under the transcriptional repression of Evi1. Exploitation of pro-survival signaling pathways is a hallmark of the cancer cell (18). Previous work has demonstrated that Evi1 functions as a survival gene in intestinal cells and mediates resistance to apoptotic stimuli by inhibiting components of TGFβ signaling (19). More recently, Evi1 expression has been associated with DNA methylation and silencing of the miRNA-124 locus (20). Our work broadens the role of Evi1 in colonic carcinogenesis to include components of the miRNA pathway affecting cellular levels of the K-Ras oncogene. While our experiments have been confined to primary colonic cells and cell lines, it would be worthwhile to determine whether this axis is operational in other cancers associated with miRNA-143 under expression (e.g. ovarian, esophageal, bladder and B-cell cancer). Lastly, our findings suggest that pharmacologic targeting of Evi1 may lead to miRNA-143 up-regulation which may offer therapeutic benefit in colon cancer.
Supplementary Material
5. Acknowledgements
This work was supported by a Clinical Scientist Development award from the Doris Duke Charitable Foundation (BR). We thank the Lifespan/Tufts/Brown CFAR’s Retrovirology Services Laboratory (NIHP30AI042853), the Center for Cancer Research Development (NIHP20RR017695) and the Center for Stem Cell Biology (P20RR018757) for assay support.
Footnotes
Publisher's Disclaimer: This is a PDF file of an unedited manuscript that has been accepted for publication. As a service to our customers we are providing this early version of the manuscript. The manuscript will undergo copyediting, typesetting, and review of the resulting proof before it is published in its final citable form. Please note that during the production process errors may be discovered which could affect the content, and all legal disclaimers that apply to the journal pertain.
6. References
- 1.Lu J, Getz G, Miska EA, Alvarez-Saavedra E, Lamb J, Peck D, Sweet-Cordero A, Ebert BL, Mak RH, Ferrando AA, et al. MicroRNA expression profiles classify human cancers. Nature. 2005;435:834–838. doi: 10.1038/nature03702. [DOI] [PubMed] [Google Scholar]
- 2.Zhang Y, Gao JS, Tang X, Tucker LD, Quesenberry P, Rigoutsos I, Ramratnam B. MicroRNA 125a and its regulation of the p53 tumor suppressor gene. FEBS Lett. 2009;583:3725–3730. doi: 10.1016/j.febslet.2009.10.002. [DOI] [PMC free article] [PubMed] [Google Scholar]
- 3.Johnson SM, Grosshans H, Shingara J, Byrom M, Jarvis R, Cheng A, Labourier E, Reinert KL, Brown D, Slack FJ. RAS is regulated by the let-7 microRNA family. Cell. 2005;120:635–647. doi: 10.1016/j.cell.2005.01.014. [DOI] [PubMed] [Google Scholar]
- 4.Le MT, Teh C, Shyh-Chang N, Xie H, Zhou B, Korzh V, Lodish HF, Lim B. MicroRNA-125b is a novel negative regulator of p53. Genes Dev. 2009;23:862–876. doi: 10.1101/gad.1767609. [DOI] [PMC free article] [PubMed] [Google Scholar]
- 5.Takagi T, Iio A, Nakagawa Y, Naoe T, Tanigawa N, Akao Y. Decreased expression of microRNA-143 and -145 in human gastric cancers. Oncology. 2009;77:12–21. doi: 10.1159/000218166. [DOI] [PubMed] [Google Scholar]
- 6.Akao Y, Nakagawa Y, Naoe T. MicroRNAs 143 and 145 are possible common onco-microRNAs in human cancers. Oncol Rep. 2006;16:845–850. [PubMed] [Google Scholar]
- 7.Miranda KC, Huynh T, Tay Y, Ang YS, Tam WL, Thomson AM, Lim B, Rigoutsos I. A pattern-based method for the identification of MicroRNA binding sites and their corresponding heteroduplexes. Cell. 2006;126:1203–1217. doi: 10.1016/j.cell.2006.07.031. [DOI] [PubMed] [Google Scholar]
- 8.Chen X, Guo X, Zhang H, Xiang Y, Chen J, Yin Y, Cai X, Wang K, Wang G, Ba Y, et al. Role of miR-143 targeting KRAS in colorectal tumorigenesis. Oncogene. 2009;28:1385–1392. doi: 10.1038/onc.2008.474. [DOI] [PubMed] [Google Scholar]
- 9.Esquela-Kerscher A, Slack FJ. Oncomirs - microRNAs with a role in cancer. Nat Rev Cancer. 2006;6:259–269. doi: 10.1038/nrc1840. [DOI] [PubMed] [Google Scholar]
- 10.Michael MZ, SM OC, van Holst Pellekaan NG, Young GP, James RJ. Reduced accumulation of specific microRNAs in colorectal neoplasia. Mol Cancer Res. 2003;1:882–891. [PubMed] [Google Scholar]
- 11.Thomson JM, Newman M, Parker JS, Morin-Kensicki EM, Wright T, Hammond SM. Extensive post-transcriptional regulation of microRNAs and its implications for cancer. Genes Dev. 2006;20:2202–2207. doi: 10.1101/gad.1444406. [DOI] [PMC free article] [PubMed] [Google Scholar]
- 12.Saini HK, Griffiths-Jones S, Enright AJ. Genomic analysis of human microRNA transcripts. Proc Natl Acad Sci U S A. 2007;104:17719–17724. doi: 10.1073/pnas.0703890104. [DOI] [PMC free article] [PubMed] [Google Scholar]
- 13.Wieser R. The oncogene and developmental regulator EVI1: expression, biochemical properties, and biological functions. Gene. 2007;396:346–357. doi: 10.1016/j.gene.2007.04.012. [DOI] [PubMed] [Google Scholar]
- 14.Hoyt PR, Bartholomew C, Davis AJ, Yutzey K, Gamer LW, Potter SS, Ihle JN, Mucenski ML. The Evi1 proto-oncogene is required at midgestation for neural, heart, and paraxial mesenchyme development. Mech Dev. 1997;65:55–70. doi: 10.1016/s0925-4773(97)00057-9. [DOI] [PubMed] [Google Scholar]
- 15.Takahashi S, Licht JD. The human promyelocytic leukemia zinc finger gene is regulated by the Evi-1 oncoprotein and a novel guanine-rich site binding protein. Leukemia. 2002;16:1755–1762. doi: 10.1038/sj.leu.2402682. [DOI] [PubMed] [Google Scholar]
- 16.Iorio MV, Visone R, Di Leva G, Donati V, Petrocca F, Casalini P, Taccioli C, Volinia S, Liu CG, Alder H, et al. MicroRNA signatures in human ovarian cancer. Cancer Res. 2007;67:8699–8707. doi: 10.1158/0008-5472.CAN-07-1936. [DOI] [PubMed] [Google Scholar]
- 17.Nanjundan M, Nakayama Y, Cheng KW, Lahad J, Liu J, Lu K, Kuo WL, Smith-McCune K, Fishman D, Gray JW, et al. Amplification of MDS1/EVI1 and EVI1, located in the 3q26.2 amplicon, is associated with favorable patient prognosis in ovarian cancer. Cancer Res. 2007;67:3074–3084. doi: 10.1158/0008-5472.CAN-06-2366. [DOI] [PubMed] [Google Scholar]
- 18.Weidhaas JB, Babar I, Nallur SM, Trang P, Roush S, Boehm M, Gillespie E, Slack FJ. MicroRNAs as potential agents to alter resistance to cytotoxic anticancer therapy. Cancer Res. 2007;67:11111–11116. doi: 10.1158/0008-5472.CAN-07-2858. [DOI] [PMC free article] [PubMed] [Google Scholar]
- 19.Liu Y, Chen L, Ko TC, Fields AP, Thompson EA. Evi1 is a survival factor which conveys resistance to both TGFbeta- and taxol-mediated cell death via PI3K/AKT. Oncogene. 2006;25:3565–3575. doi: 10.1038/sj.onc.1209403. [DOI] [PubMed] [Google Scholar]
- 20.Dickstein J, Senyuk V, Premanand K, Laricchia-Robbio L, Xu P, Cattaneo F, Fazzina R, Nucifora G. Methylation and silencing of miRNA-124 by EVI1 and self-renewal exhaustion of hematopoietic stem cells in murine myelodysplastic syndrome. Proc Natl Acad Sci U S A. 107:9783–9788. doi: 10.1073/pnas.1004297107. [DOI] [PMC free article] [PubMed] [Google Scholar]
Associated Data
This section collects any data citations, data availability statements, or supplementary materials included in this article.


