Figure 2.
Differential expression of miRNA-143, let-7a and K-Ras in colon cancer
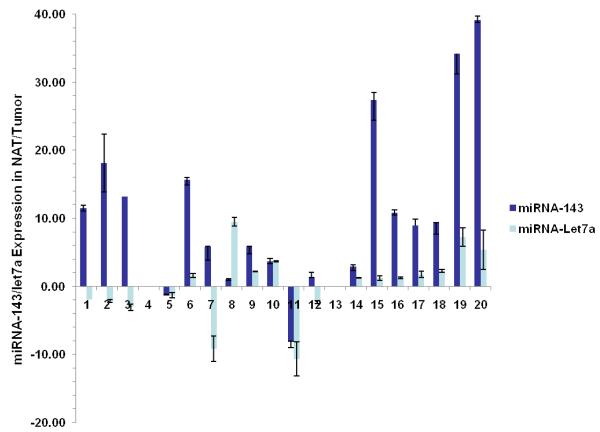
a. Real-time RT-PCR was used to quantify levels of mature miR-143 and let-7a in twenty samples of human colon cancer in both frank cancerous tissue and surrounding normal adjacent tissue (NAT). Patterns of expression are presented as fold comparisons between cancerous and NAT for each miRNA (miRNA-143: dark blue bars and let-7a: light blue bars). Data from 18 samples are presented; two outliers (cases # 4 and #13) with a >50 fold difference in miRNA-143 expression are omitted for graphical clarity. We observed a statistically significant under-expression of miRNA-143 in cancerous tissue vs. NAT (p=0.001). No such relationship was found for let-7 (p=0.263).
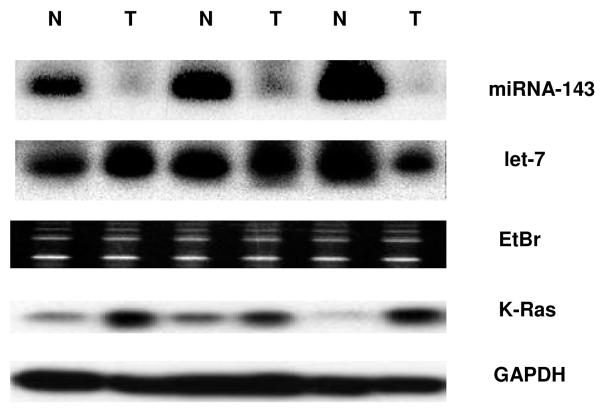
b. In agreement with Real Time RT-PCR data for mature miRNA expression level, northern blots indicated a decreased level of miRNA-143 in cancerous tissue compared to NAT. No such difference was observed for let-7a in the samples studied. A strong inverse relationship was observed between levels of miRNA-143 and K-Ras, the latter quantified by western blot. GAPDH protein levels served as a loading control for western blot.


