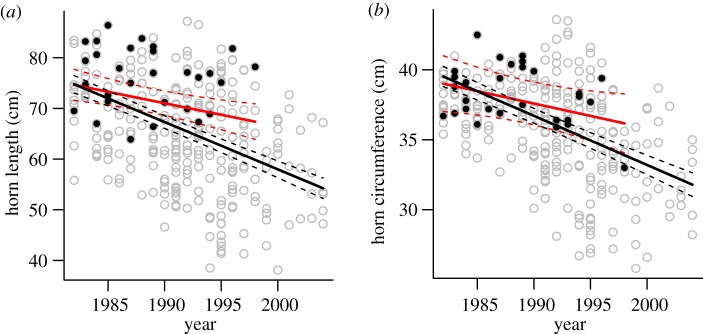
Figure 2.
Predicted temporal trends in horn size of 5-year-old bighorn rams at Ram Mountain from 1982 to 2004 for (a) horn length and (b) horn base circumference. Black circles and red line represent data from shot rams. This regression line stops in 1998 because no rams were harvested thereafter. Empty grey circles and black line are horn measurements of all rams in the population. Dotted lines are the 95% confidence intervals, whose divergence on (a) suggests that the slope estimate from shot rams differs significantly from the estimate for the entire population.

