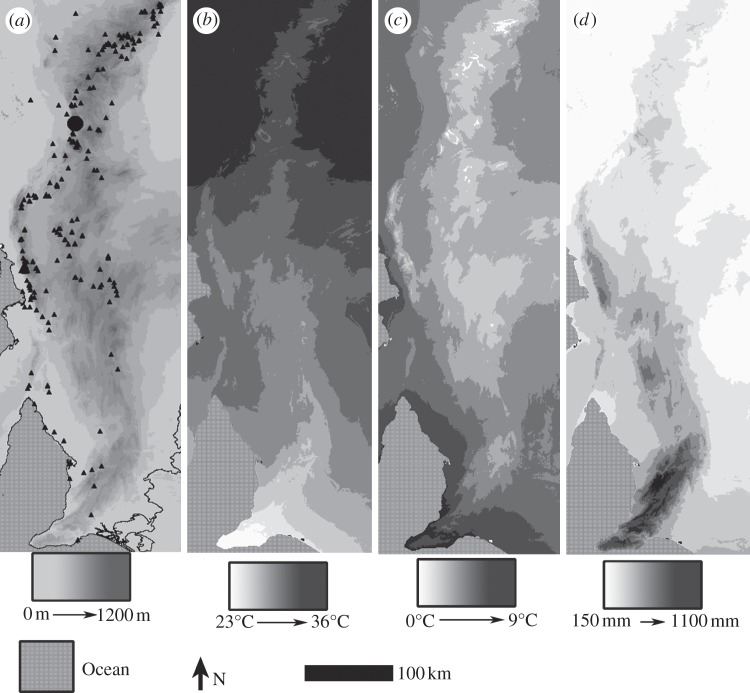
Figure 1.
Maps of study region (Adelaide Geosyncline) and key climate gradients. (a) Field altitude sampling site (large filled circle) and collection locations of historical herbarium specimens of Dodonaea viscosa subsp. angustissima used in the study (triangles) over altitude base map; (b) mean maximum temperature of warmest month; (c) mean minimum temperature of coldest month and (d) mean annual rainfall.

