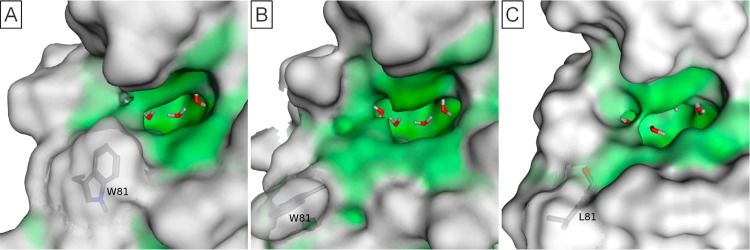
Figure 10.
Comparison of BRD2(2) structures. Surface colors consistent with Figure 9. (A) BRD2(2) PDB 3E3K_C structure showing typical BET family conformation. (B) BRD2(2) PDB 2E3K_B structure showing atypical conformation. (C) CREBBP PDB 3DWY_A structure showing similarity to BRD2(2) atypical conformation.

