Figure 4. .
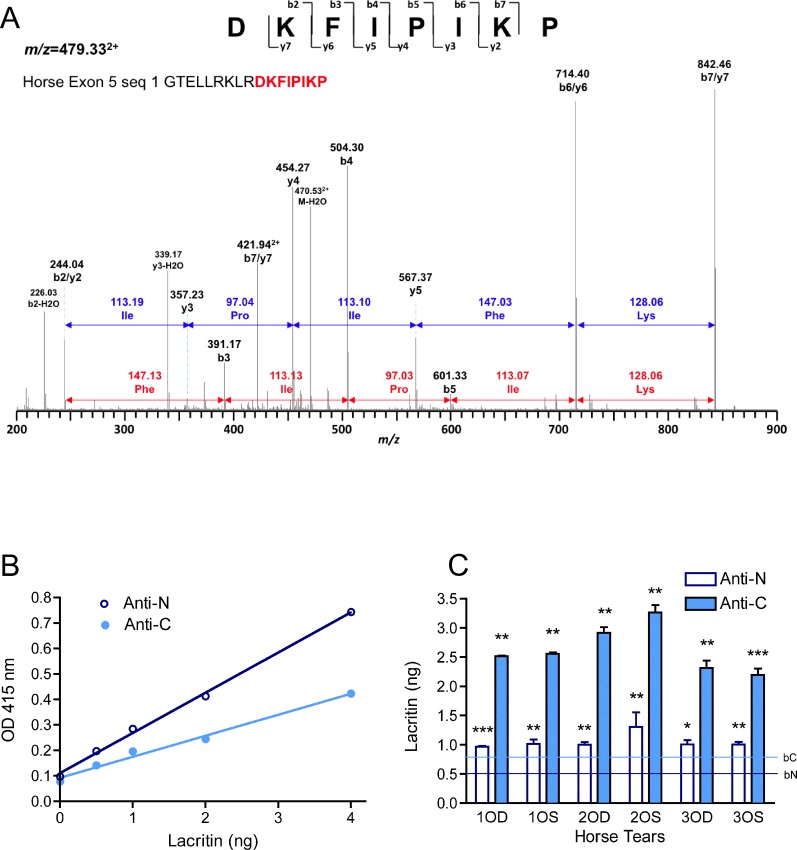
Mass spectrometric analysis and ELISA quantitation of horse lacritin protein. (A) Mass spectrometric analysis was performed on the 13 kDa band from horse tears. The peak at m/z = 479.332+ was sequenced by MSMS as DKFIPIKP (from horse lacritin GTELLRKLRDKFIPIKP). (B) Plastic wells of 96-well plates were incubated with increasing amounts of recombinant human lacritin at sufficiently low levels for complete adsorption.12 Detection was with anti-C- and -N-terminal lacritin antibodies using peroxidase-conjugated secondary antibody and OPD detection. Standard curves of anti-C- and -N-terminal absorbance (R2 = 0.99275, 0.98739) were developed. (C) Plastic wells of 96-well plates were incubated with sufficiently low levels of horse tears for almost complete expected adsorption. Coated wells were treated with anti-C- and -N-terminal lacritin antibodies with secondary antibody and OPD detection. Absorbance levels were adjusted with standard curves to approximate nanogram levels of lacritin protein. Significance compares amounts to background. *P < 0.01–0.05; **P < 0.01–0.001; ***P < 0.001.

