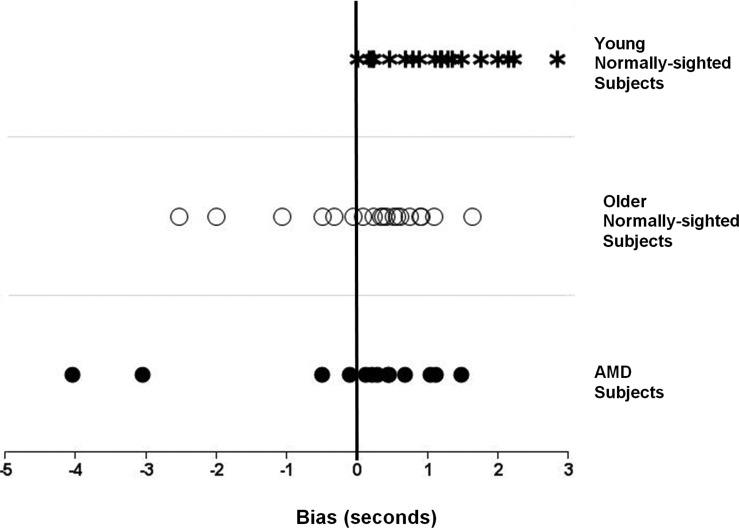
Figure 2. .
Plot of street-crossing bias values measured in each subject group shows the distribution of bias values for each subject group. There is a tendency for the older normally-sighted and AMD subjects to have more negative bias values compared to the young normally-sighted subjects. Negative bias values represent an unsafe street-crossing strategy, while positive bias values represent a safe street-crossing strategy.

