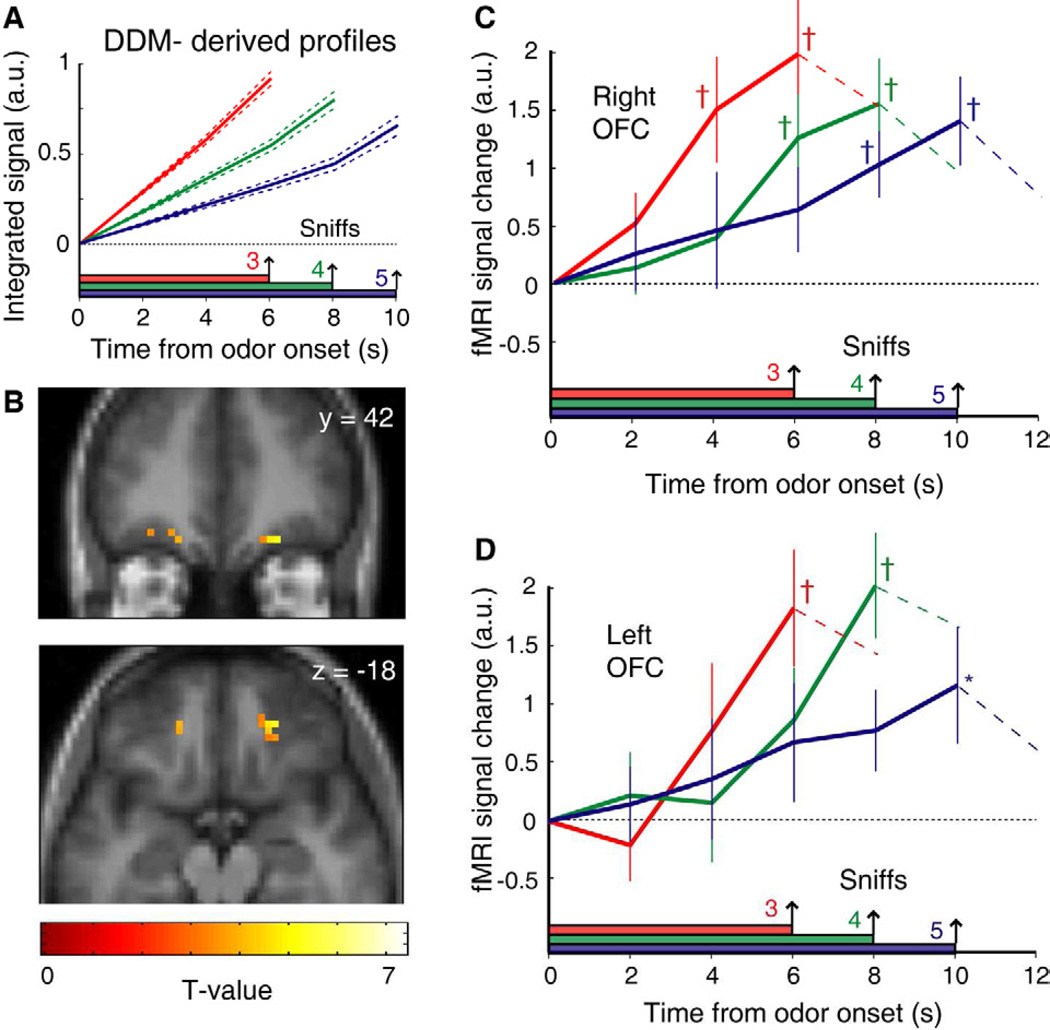
Figure 5. Odor evidence integration in medial OFC.
(A) Idealized time-series profiles of evidence integration for 3-, 4-, and 5-sample (sniff) trials were generated from behaviorally-derived parameters from each subject’s collapsing-bounds DDM. (B) Regression of the fMRI time-series data against the integration profiles in (A) revealed significant activation in medial OFC (p < 0.05, small-volume corrected). Images overlaid on coronal (top) and axial (bottom) sections of the mean T1-weighted MRI scan (display threshold, p < 0.005; error bars, SEM.). (C–D) Group-averaged deconvolved fMRI time-series (pooled across all significant voxels, p < 0.005) from right (C) and left (D) OFC demonstrate that orbitofrontal activity increases over time and peaks at the time of decision. All activations are normalized to odor onset. *, p < 0.05; †, p < 0.01, differences from baseline.

