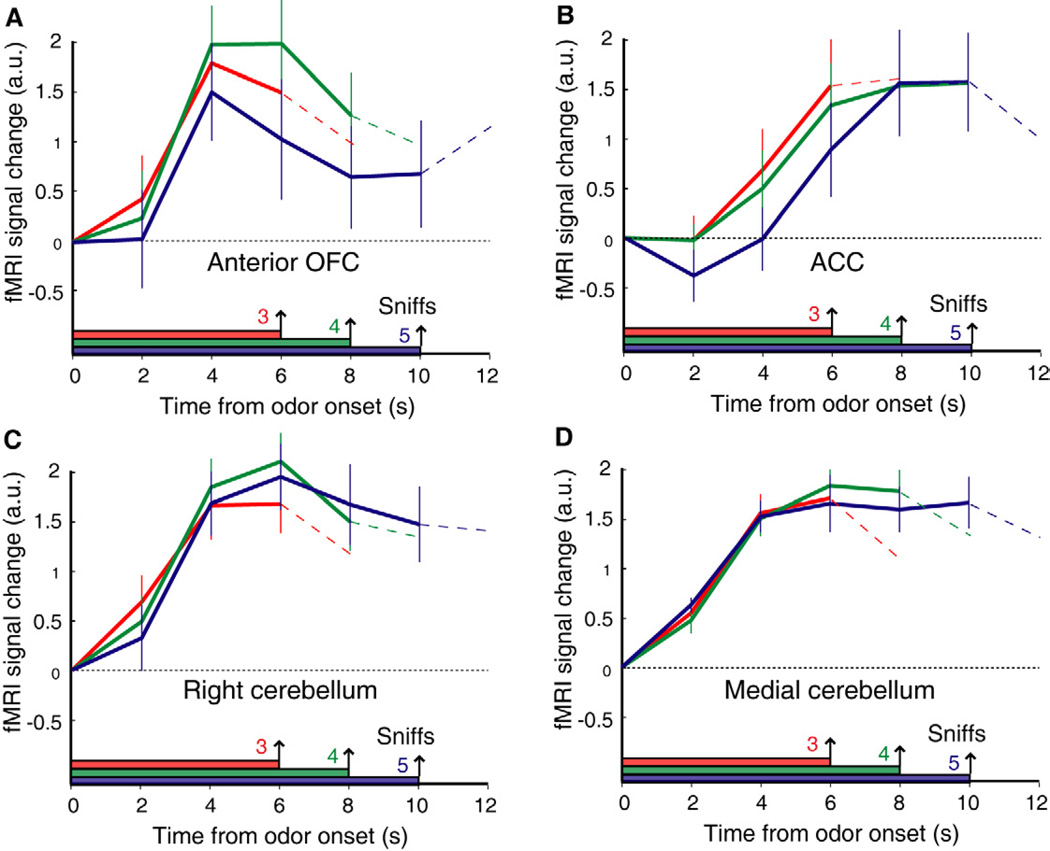
Figure 6. Time-series profiles of increasing fMRI activity in other brain areas.
Correlations between the integration model and the FIR imaging data-set identified several other regions with fMRI activity that increased over time (p < 0.001 uncorrected), including right anterior OFC (A), anterior cingulate cortex (B), right lateral cerebellum (C), and medial cerebellum (D). These time-series, averaged across subjects (mean ± SEM, deconvolved) are not compatible with temporal integration, as predicted by the DDM.

