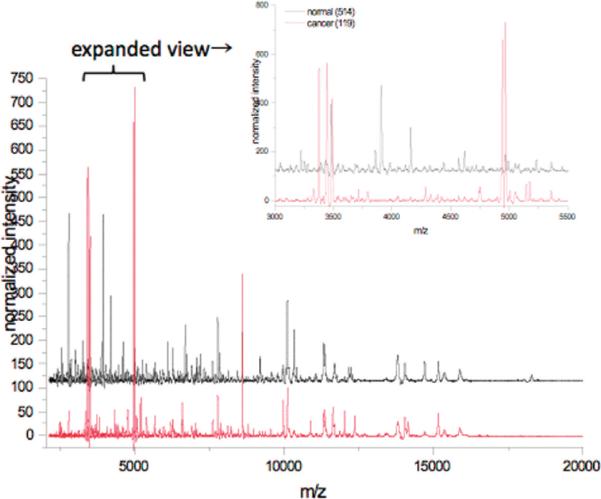
Figure 2.

Representative average mass spectra from one normal patient (black) and one cancer patient (red). The area from m/z 3000–5500 has been expanded to highlight differences. The normal spectrum is an average of 8 independent measurements; the cancer spectrum is an average of 9 independent measurements.
