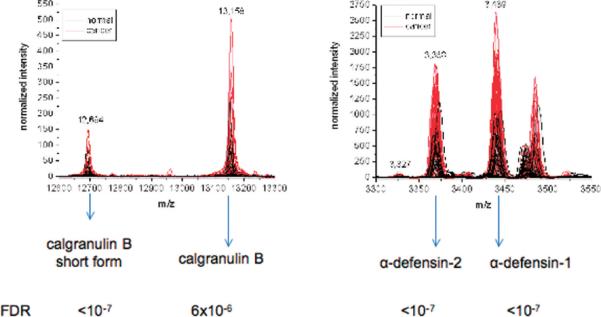
Figure 4.
Intensity profile for identified discriminatory signals among 63 cancer patient samples (red) and 43 samples from healthy volunteers (black). The false discovery rate (FDR) was estimated as the proportion of the signal with univariate P values less than or equal to the P value of each identified signal, using the method of Benjami and Hochberg.28

