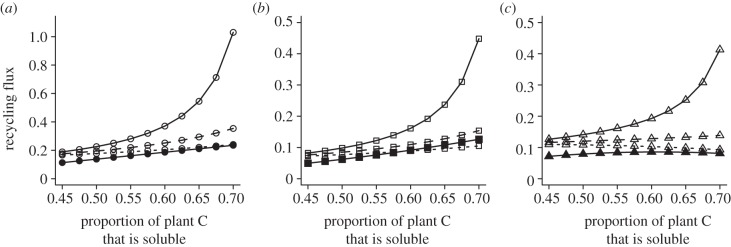
Figure 4.
(a) Total flux of nitrogen, (b) soluble carbon and (c) recalcitrant carbon recycled to the soil nutrient pools. Results are for models with predation risk (open symbols, β = 0.85) and without predation risk (filled symbols, β = 0.5). We show results under predation risk for three levels of herbivore respiration (π = 0.5 (solid lines), 0.6 (dashed lines), 0.7 (dotted lines)). All other parameters are as defined in figure 2. See the electronic supplementary material, appendix S3 and S5 for analytical results.

