Table 1.
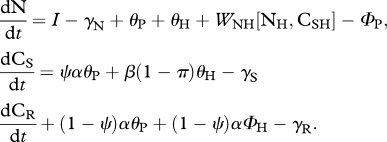
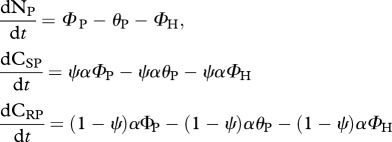
Stoichiometrically explicit model of a terrestrial herbivore–plant–soil nutrient ecosystem with function and parameter definitions. See figure 1 for a conceptual diagram of the ecosystem model.
| model equations | description |
|---|---|
soil nutrients: 
|
state variables: Ni, nitrogen stock in trophic level i; CSi, soluble carbon stock in trophic level i; CRi, recalcitrant carbon stock in trophic level i |
plants: 
|
functions: γi, flux of element i lost from soil nutrient pool; θi, nitrogen flux recycled by trophic level i; WNH[NH, CSH], herbivore differential assimilation rate of nitrogen; WCH[NH, CSH], herbivore differential assimilation rate of soluble carbon; ΦP, nitrogen flux from the soil nutrient pool to plants; ΦH, nitrogen flux from plants to herbivores |
herbivores: 
|
function definitions: γN
=
kN; γS = f(CS, N) = qSCSN; γR = qRCR;
θP = rPNP; θH = rHNH; ΦP = aPCSN; ΦH = aHNPNH;

|
| parameters: I, independent nitrogen input rate to the soil nutrient pool; k, nitrogen loss rate from soil nutrient pool; qS, soluble carbon loss rate from soil nutrient pool; qR, recalcitrant carbon loss rate from soil nutrient pool; aP, nitrogen mineralization rate; aH, herbivore nutrition rate; ri, nitrogen-recycling rate of trophic level i; π, proportion of soluble carbon respired by herbivores; ψ, proportion of plant carbon that is soluble; α, CP : NP ratio; β, CSH : NH ratio |
