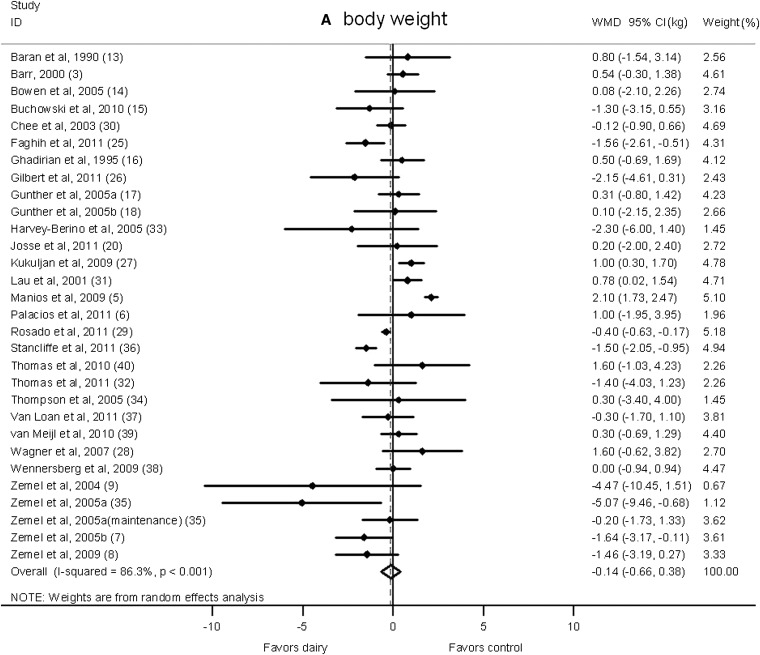
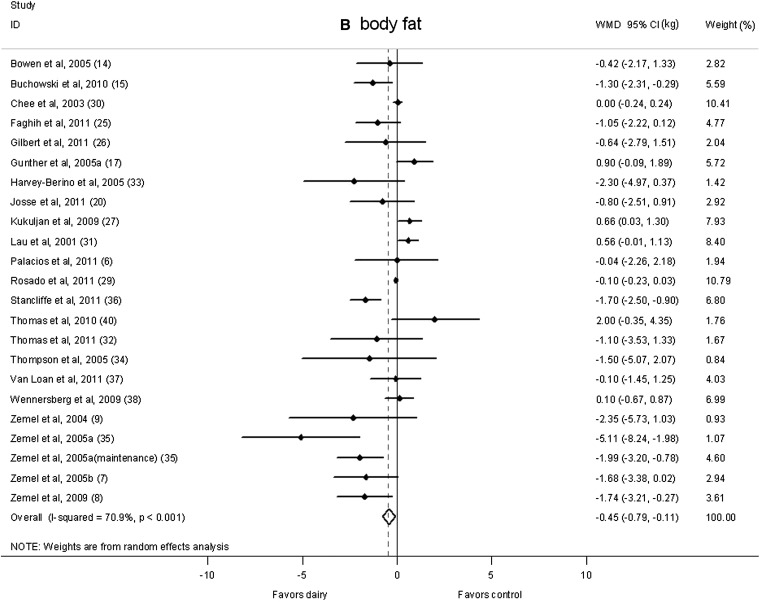
FIGURE 2.
Net change (95% CI) in body weight (A) and fat (B) associated with dairy interventions expressed as the change (kg) during the intervention with dairy products minus the change during control regimen. Horizontal lines denote the 95% CIs; solid diamonds represent the point estimate of each study. The open diamond represents the pooled estimate of the intervention effect. The dashed line denotes the point estimate of the pooled result. ID, identification; WMD, weighted mean difference.


