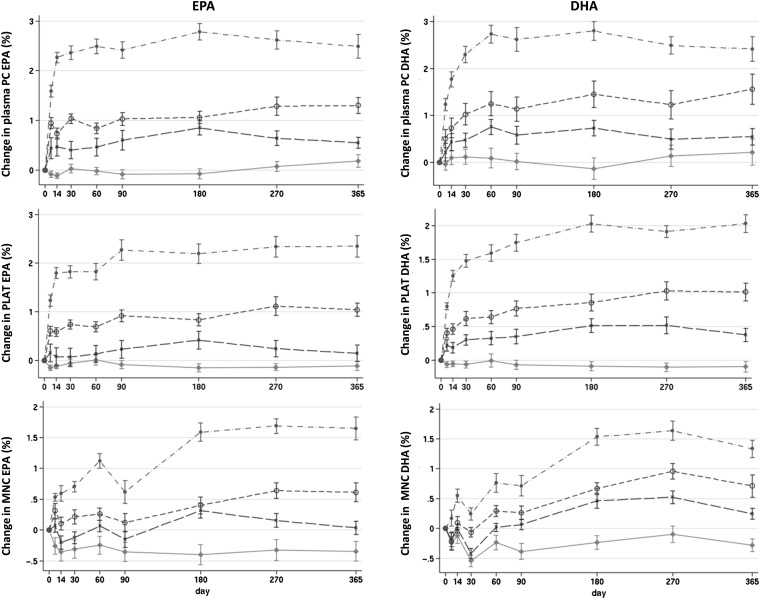
FIGURE 3.
Mean (±SE) changes from baseline of EPA and DHA concentration (percentage of total fatty acids) in plasma PC, PLAT, and MNC in response to EPA and DHA equivalent to 0, 1, 2, and 4 portions of oily fish per week for 12 mo. The control group is represented by diamonds, the 1-portion group is represented by Xs, the 2-portions group is represented by open circles, and the 4-portions group is represented by closed circles. The panels provide graphical representation of EPA and DHA responses to doses over the 12-mo intervention. Statistical analyses of responses are shown in Tables 2–4. MNC, mononuclear cells; PC, plasma phosphatidylcholine; PLAT, platelets.

