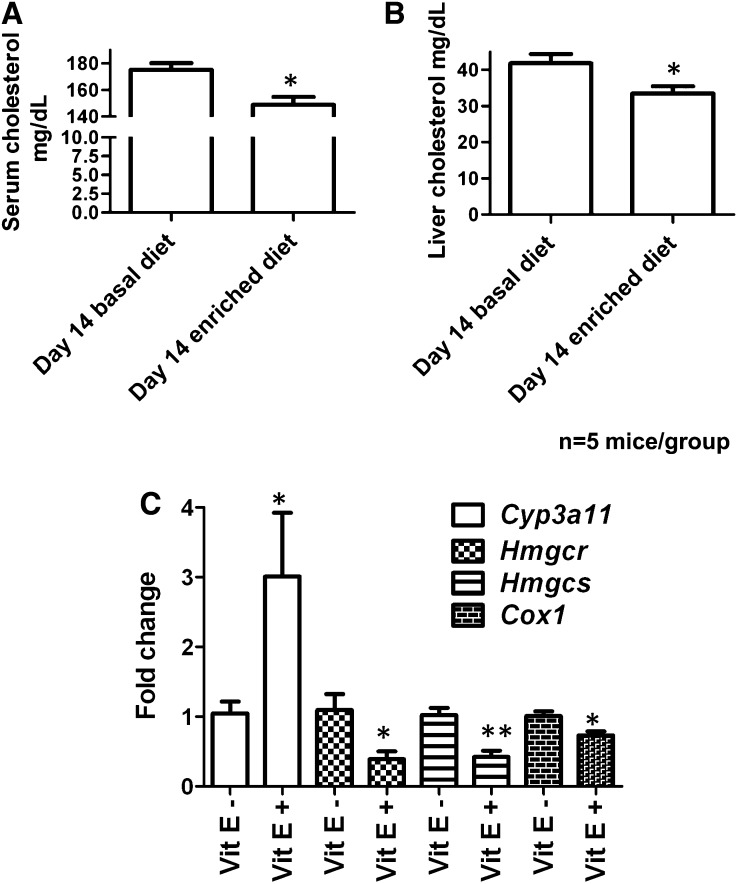
FIGURE 8.
Serum cholesterol (A) and liver cholesterol (B) concentrations in mice fed vitamin E–deficient and –enriched diets for 14 d. C: Gene expression analysis by quantitative polymerase chain reaction of genes affected by vitamin E dosing: Cyp3a11, Cox-2, Hmgcr, Hmgcs, and Cox-1. All values are normalized to β-actin and expressed as fold change (mean ± SEM). Significance was determined with the Mann-Whitney U test between the vitamin E–deficient and vitamin E–enriched diets. Two-tailed P value: **P < 0.01, *P < 0.05. Vit E, vitamin E.

