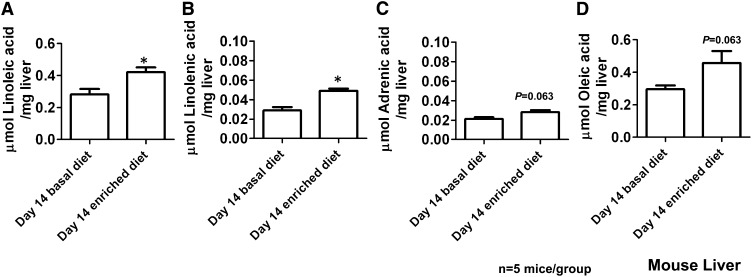
FIGURE 9.
Mean (±SEM) concentrations of fatty acid metabolites [linoleic acid (A), linolenic acid (B), adrenic acid (C), oleic acid (D)] identified in mouse liver. Significance was determined with a Mann-Whitney U test between the vitamin E–deficient and vitamin E–enriched diets. Two-tailed P value: *P < 0.05.

