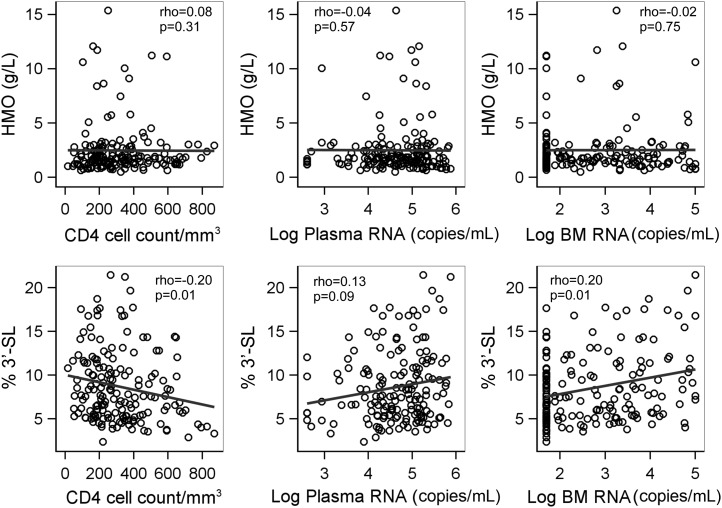
FIGURE 3.
Scatter plots of total HMO and percentage of 3′-SL per total HMO by CD4 cell count plasma viral load and breast-milk HIV RNA viral load at 1 mo among 167 HIV-infected mothers. Spearman's coefficients (ρ) and P values are shown. BM, breast milk; HMO, human milk oligosaccharide; 3′-SL, 3′-sialyllactose.

