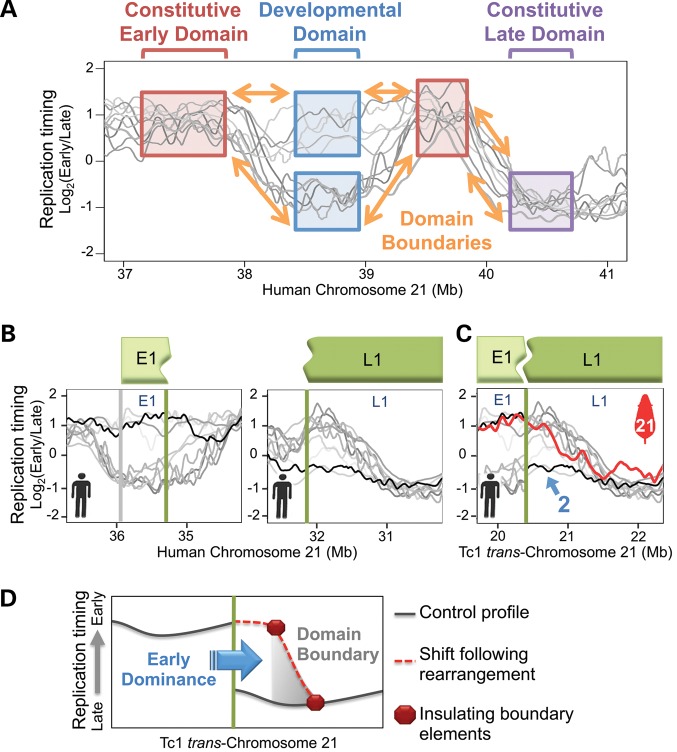
Figure 4.
Replication boundaries insulate domains from position effects. (A) Replication-timing profiles from various human cell types (shades of gray, see Materials and methods) are shown across 4 Mb of Hsa21 to exemplify the method employed to classify Tc1-21 fragments in Table 1. Examples of constitutive and developmentally regulated replication-timing domains are boxed and labeled with brackets. Boundaries connecting adjacent domains are indicated with orange arrows. (B) Control Hsa21 replication-timing profiles from fibroblasts (black) and other various human cell types (shades of gray, see Materials and methods) are plotted across both regions involved in an early–late fusion in Figure 3A. Fragments E1 and L1 correspond, respectively, to 647 and 5960 kb fragments from Table 1. Vertical green lines mark the point of early–late fusion at which two developmental domains are adjoined without a domain boundary in between. The vertical gray line marks the opposite end of fragment E1. The opposite end of fragment L1 is not shown due to its distance from the early–late fusion point. (C) Fragments E1 and L1 from (B) are plotted in Tc1-21 arrangement. Tc1-21 fibroblast (red) replication-timing profile is overlaid on profiles from control human fibroblasts (black) and other human cell types (shades of gray, see Materials and methods). The same numbered blue arrow in Figure 1B is shown to indicate a region in which Tc1-21 replication timing deviates from Hsa21 controls. (D) Illustrated model depicts a shift to early replication on the late side of an early–late fusion (vertical green line). The dominant position effect (early replication) spreads up to the nearest developmental domain boundary (gray triangle), which contains insulating elements (red octagons) that prevent further spreading.

