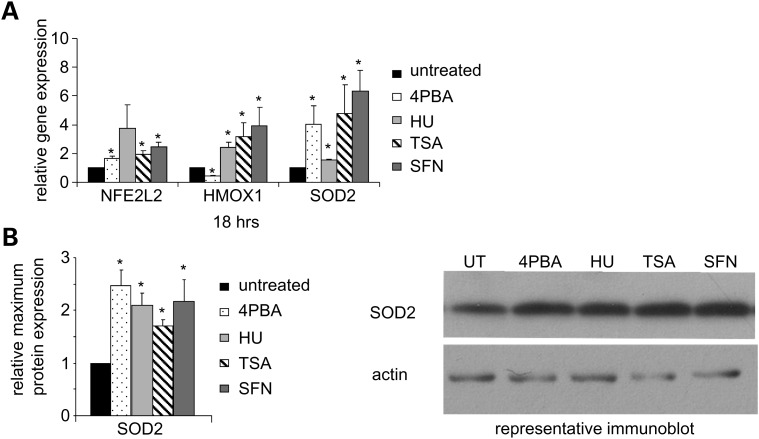
Figure 7.
The antioxidant response is induced by 4PBA, HU, TSA or SFN treatment. (A) RT-PCR analyses of mRNA expression of antioxidant genes. Normal human fibroblasts were treated for 18 h. The expression of NFE2L2, HMOX1 and SOD2 was measured as described in Figure 2E. The P-value for the NFE2L2 HU measurements was 0.11. (B) Immunoblot analyses of SOD2 protein expression. Normal human fibroblasts were treated for 2 to 5 days. The mean of the relative expression of SOD2 (26 kDa) across three or more independent experiments is plotted for each treatment as fold change (drug treated/untreated). Actin (43 kDa) was used as a loading control. *Statistical significance (P ≤ 0.05). Bars = SEM for n ≥ 3 independent experiments.

