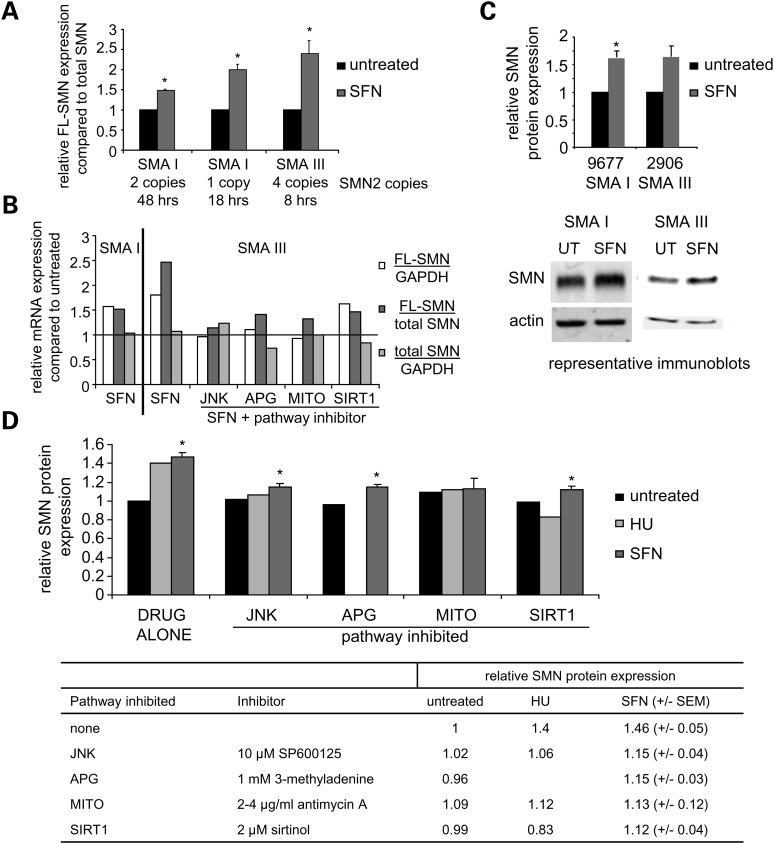
Figure 9.
The induction of FL-SMN mRNA expression and SMN protein expression by SFN is dependent on the JNK pathway, autophagy, mitochondrial biogenesis and SIRT1 activity. (A) RT-PCR analyses of FL-SMN mRNA expression compared with total SMN transcript expression. Type I and type III spinal muscular atrophy (SMA I or SMA III) fibroblasts were treated with SFN for the indicated times. The relative fold increase in the ratio of FL-SMN/total SMN transcripts compared with the untreated cell line (normalized to 1) is plotted. Cell lines from left to right are GM09677, GM00232 and 2906. N ≥ 2 independent experiments. (B) RT-PCR analyses of FL-SMN and total SMN mRNA expression. Spinal muscular atrophy fibroblasts were treated with 1.5 μm SFN alone for 51 h (SMA I, GM09677) or treated with 0.5 μm SFN for 8h (SMA III, 2906) with or without 12.5 µm SP600125 (JNK inhibitor), 2.5 mm 3-methyladenine (autophagy inhibitor, APG), 5 µg/ml antimycin A (mitochondrial inhibitor, MITO) or 3 µm sirtinol (SIRT1 inhibitor). The fold increases in FL-SMN expression compared with either GAPDH or total SMN expression and the fold increase in total SMN expression compared with GAPDH expression after SFN treatment is plotted. Untreated values were normalized to 1 and are indicated by the horizontal line. (n = 1 per cell line, performed in duplicate) (C) Immunoblot analyses of SMN protein expression. Spinal muscular atrophy type I (SMA I; GM09677, n = 7) or type III (SMA III; 2906, n= 2) fibroblasts were treated with either 1.5 µm SFN or 0.5–2 µm SFN, respectively, for 48–72 h. The average of the relative expression of SMN protein (39 kDa) is plotted. Actin (43 kDa) was used as a loading control. (D) Summary of the effects of stress pathway inhibitors on SMN protein expression. Spinal muscular atrophy type I (SMA I; GM09677) fibroblasts were treated with either 300 μm HU (n = 1) or 1.5 μm SFN (n ≥ 3) in the presence or absence of 10 μm SP600125 (JNK inhibitor), 1 mm 3-methyladenine (APG inhibitor), 2–4 μg/ml antimycin A (MITO inhibitor) or 2 μm sirtinol (SIRT1 inhibitor) for 48 h. SMN protein expression was measured by quantitative immunoblot analyses using actin as a loading control. Fold increases in SMN protein expression are plotted and represented numerically in the table below the graph. Untreated values are normalized to 1. *P ≤ 0.05; bars = SEM.

