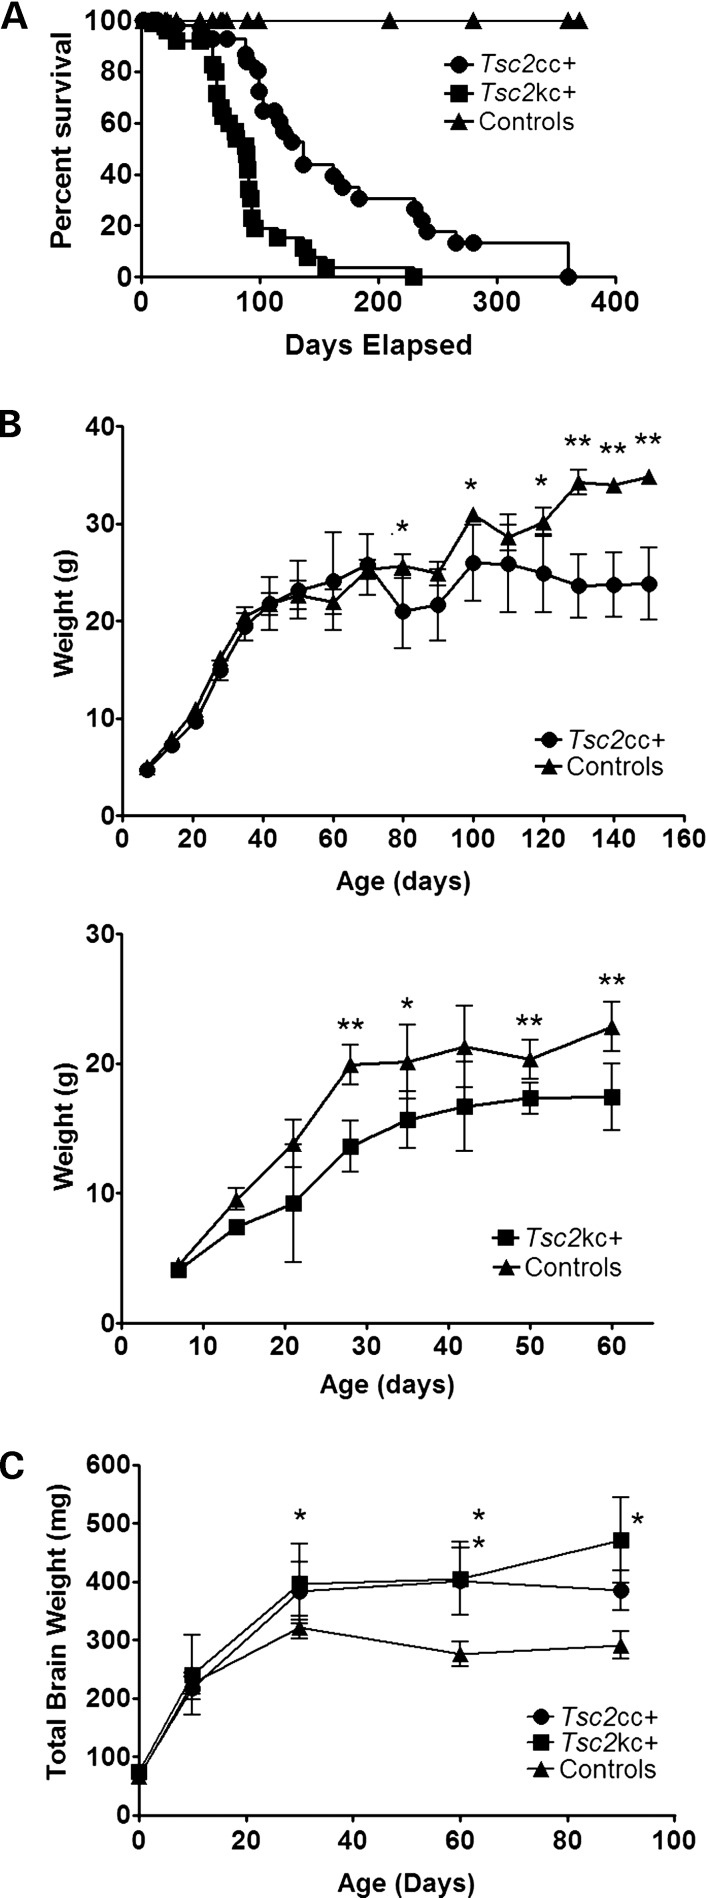
Figure 1.
Survival, weight gain and brain weights of Tsc2kc+ and Tsc2cc+ mice. (A) The cumulative survival curve of Tsc2kc+ (n = 97), Tsc2cc+ (n = 60) and control (n = 62) mice. Median survival of Tsc2kc+ and Tsc2cc+ mice is 89 and 137 days, respectively. Pairwise comparison of each survival curve is significantly different (P < 0.0001, Mantel–Haenszel test). (B) Weight gain in Tsc2cc+ (top) and Tsc2kc+ (bottom) mice. Mean and standard deviation are shown. *P< 0.05; **P < 0.001; by the Mann–Whitney test. n > 3 for each cohort at each time point. Equal numbers of male and female mice were used for each genotype. (C) Brain weight of Tsc2kc+ and Tsc2cc+ mice, and controls. Mean and standard deviation are shown. *P< 0.05; **P < 0.001; by the Mann–Whitney test in comparison with control mice. n ≥ 3 for each cohort at each time point, except n = 2 for Tsc2kc+ at 90 days.

