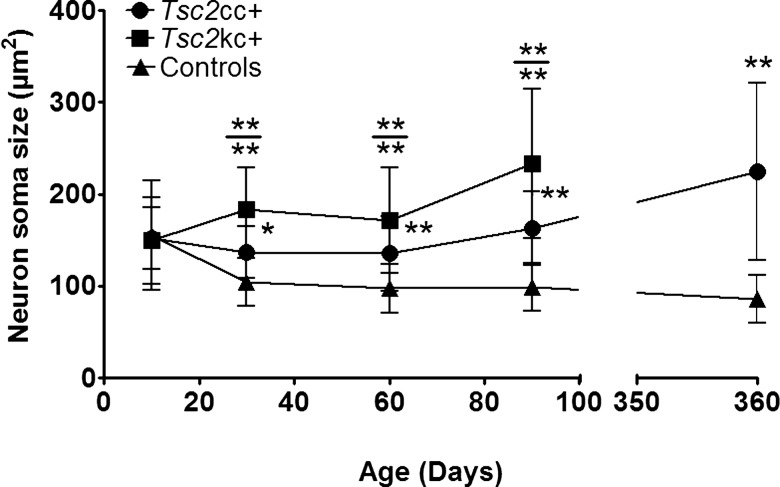
Figure 4.
Neuron soma size in Tsc2kc+ and Tsc2cc+ mice. Average neuron soma size with standard deviations are shown according to age for each type of mutant. Neurons were measured in layers IV–V of the M1 region of cerebral cortex. *P< 0.05; **P < 0.001; by the Mann–Whitney test. Asterisks above a data set indicate comparison with control mice; asterisks above the bar (at top) indicate comparison between Tsc2kc+ and Tsc2cc+. n ≥ 2 mice for each cohort at each time point.

