Figure 7.
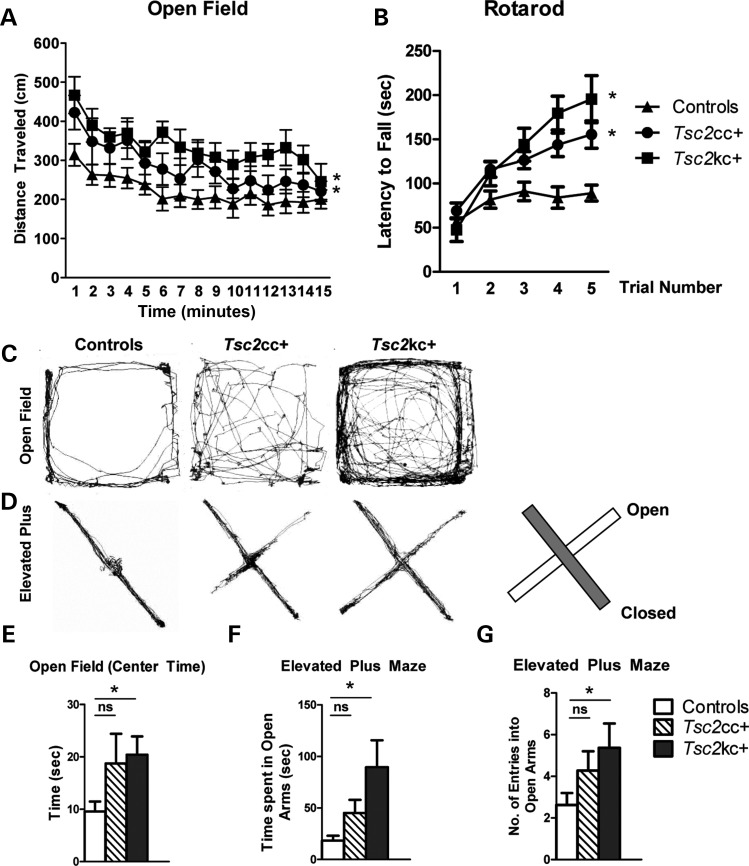
Locomotor activity in Tsc2 mutant mice. (A) Tsc2 mutants display increased distance traveled (cm) in the open field. Time in minutes is shown on the x-axis. *P < 0.05 mutant versus control. Total n = 40; minimum n per genotype = 8. (B) Tsc2 mutants display increased time on an accelerating rotarod. *P < 0.05 mutant versus control, trials 3–5. Total n = 25; minimum n per genotype = 6. *P < 0.05 mutant versus control. (C and D) Representative open-field (C) and elevated plus maze (D) track plots. Diagram illustrates locations of open and closed arms of the maze. (E) Tsc2kc+ mice display increased time spent in the center quadrant of the open field. Same n as (A). (F and G) Tsc2kc+ mice spend more time (F) and enter into the closed arms of the elevated plus maze more frequently (F) in comparison with control littermates. Total n = 41; minimum n per genotype = 10. *P < 0.05. ns, not significant. All P-values by the t-test, except open field by ANOVA.

